
|
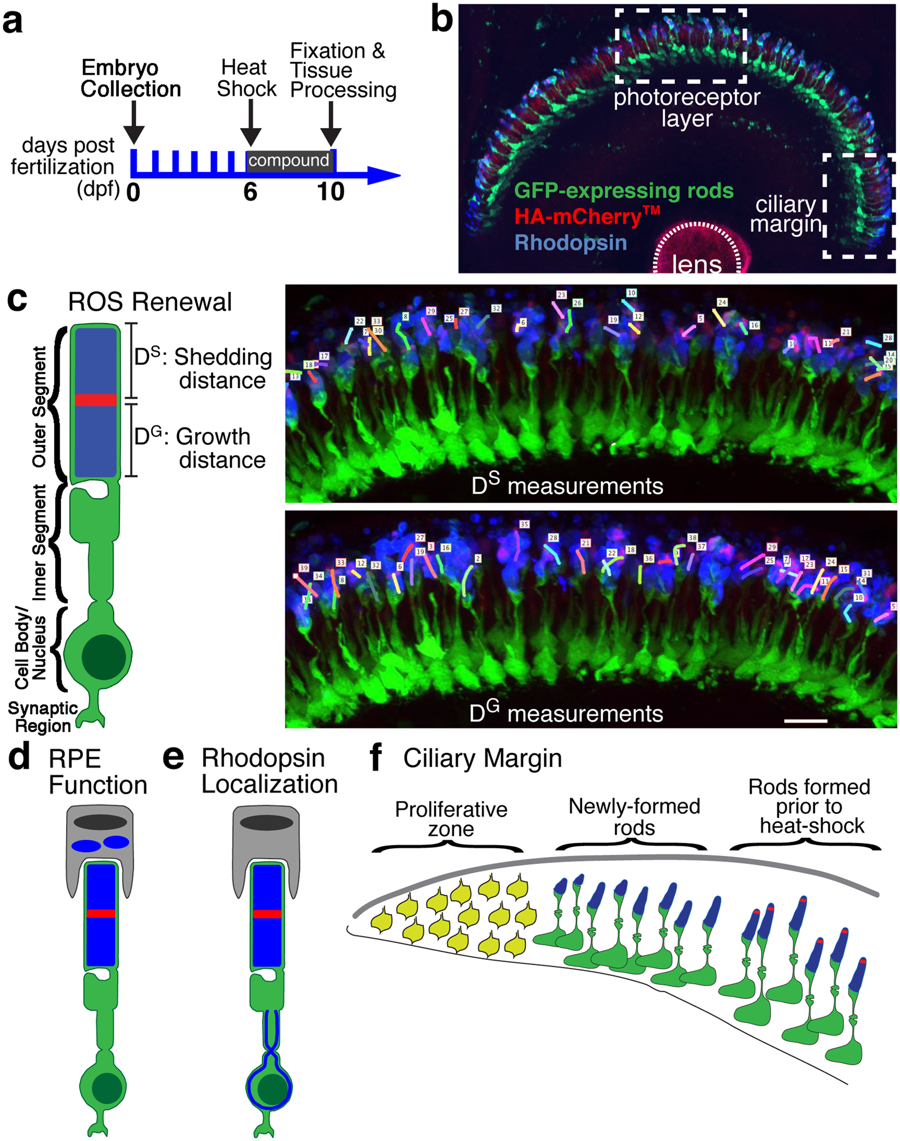
Fig. 1
High-content screening of 1351 bioactive small molecules for ROS renewal. (a) Work-flow for high-content, image-based screen. Tg(Xla.rho:EGFP); Tg(hsp70:HA-mCherryTM); alb−/− fish were heat shocked at 6 dpf to induce expression of HA-mCherryTM followed by rearing in 20 μM compound until 10 dpf when tissues were fixed and processed for immunolabeling and confocal microscopy. (b) Confocal z-stack images were acquired of the GFP (green) and HA-mCherryTM stripe (red)-expressing rods labeled with anti-Rhodopsin antibody (blue) in two regions of interest: the photoreceptor layer and ciliary margin (white-hatched boxes). (c) ROS renewal was measured within the three-dimensional z-stacks with the growth distance (DG) representing the distance from the base of the ROS to the mCherryTM stripe and the shedding distance (DS) representing the distance from the mCherryTM stripe to the tip of the outer segment. Scale bar is 10 μm. (d,e) Qualitative changes in the photoreceptor layer were documented, including the (d) accumulation of phagosomes and (e) Rhodopsin mislocalization. (f) Qualitative changes in the ciliary margin were documented, such as the size of the proliferative zone and addition of new rods during compound treatment, which can be identified by lack of the mCherryTM stripe.