
|
Fig. 5
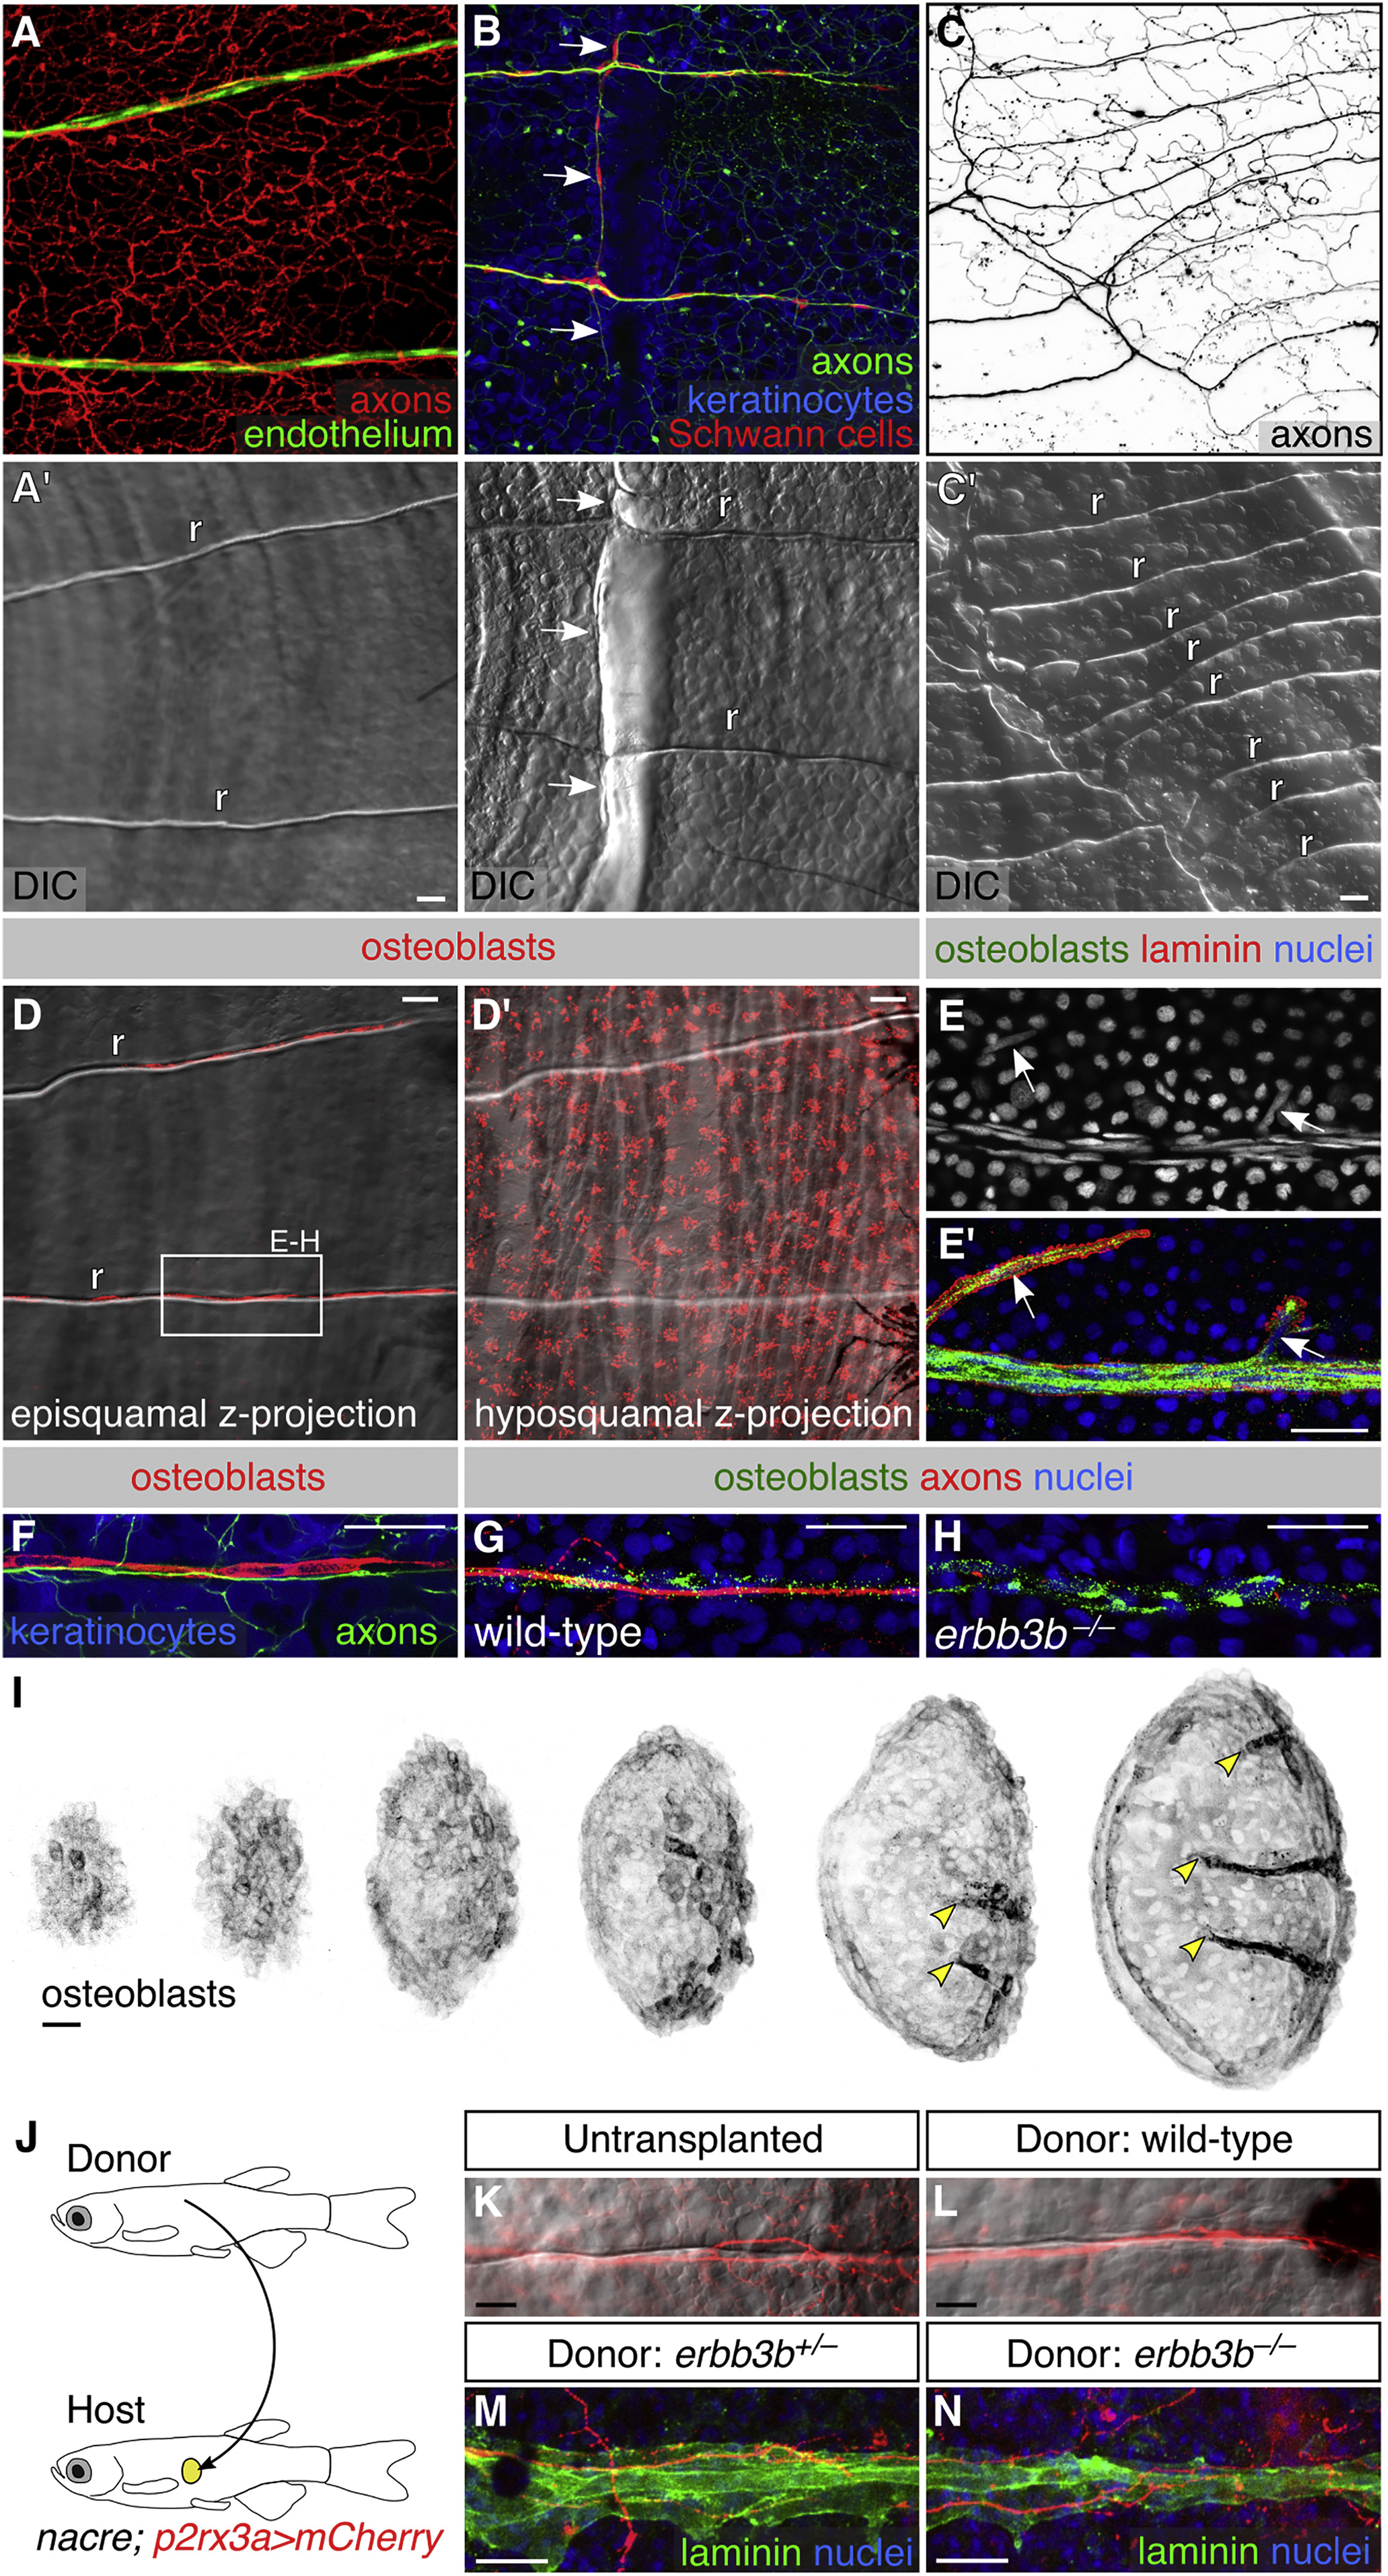
Neurovascular Congruence with Radial Osteoblasts.
(A–C) Fluorescent and differential interference contrast (DIC) images showing congruence between nerves and scale radii in wild-type animals. r, radius. Arrows, areas of nerve-radius congruence. In (C), the scale was from a 2-year-old, 31 mm SL fish. r, radius.
(D) Episquamal osteoblasts localize along radii.
(E) Scale nerve immunostained as indicated. Note the close apposition between osteoblasts and laminin staining. Arrows, single osteoblast nuclei.
(F) Congruence between episquamal osteoblasts and scale nerve.
(G and H) Representative scale nerves from adult wild-type and erbb3b−/− fish immunostained for indicated markers. Note that radial osteoblasts form normally in the absence of axons.
(I) Lateral views of nascent scales imaged from the anterior region of an intact animal at stage 10 mm SL (43 days post fertilization). Scales develop asynchronously from posterior to anterior (Sire et al., 1997a). Individual scales from adjacent regions of the body were cropped and ordered by size to create this composite. Note that radial osteoblasts first appear near the posterior scale margin (arrowheads).
(J) Schematic of scale transplant experiments.
(K and L) Widefield images of untransplanted control (K) and transplanted (L) scales showing sensory axons along a single radius. Images show overlays of the mCherry and DIC channels.
(M and N) Immunostaining of transplanted scales from donor fish of the indicated genotypes. Laminin staining marks the radii. Note growth of host axons along the donor radii.
Transgenes: (A) endothelium (Tg(fli1a:EGFP)) and axons (Tg(p2rx3a>mCherry)); (B) axons (Tg(p2rx3b:EGFP)), and keratinocytes and Schwann cells (Tg(-28.5Sox10:Cre);Tg(actb2:BswitchR)); (C) Tg(p2rx3a>mCherry); (D) Tg(sp7:mCherry-nfsB); (F) axons (Tg(p2rx3b:EGFP)), osteoblasts (Tg(sp7:mCherry-nfsB)), and keratinocytes (Tg(actb2:BswitchR)); (I) Tg(sp7:mCherry-nfsB). Staining: (E) osteoblasts (zns-5), laminin (anti-laminin), and nuclei (DAPI); (G and H) osteoblasts (zns-5), axons (acTubulin), and nuclei (DAPI); (M and N) laminin (anti-laminin) and nuclei (DAPI). Scale bars, 25 μm. See also Figures S5 and S6.
Reprinted from Developmental Cell, 46(3), Rasmussen, J.P., Vo, N.T., Sagasti, A., Fish Scales Dictate the Pattern of Adult Skin Innervation and Vascularization, 344-359.e4, Copyright (2018) with permission from Elsevier. Full text @ Dev. Cell