
|
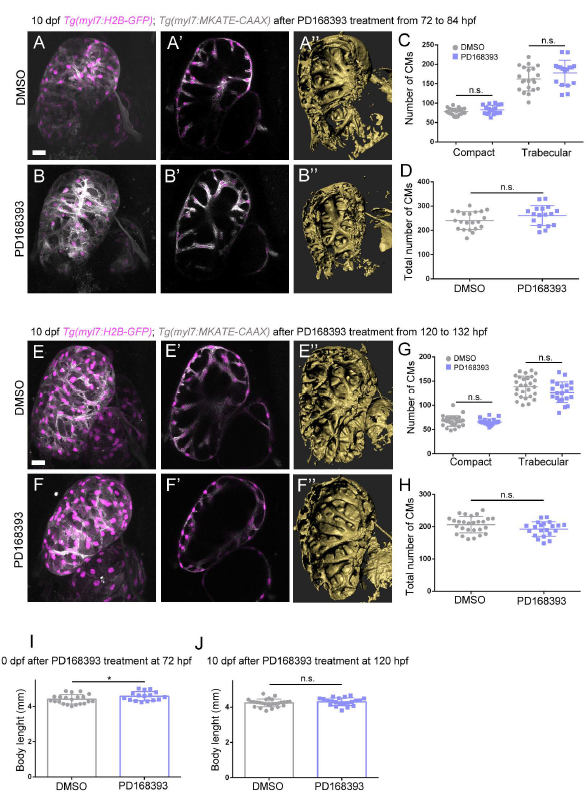
Fig. S6 Effects of Erbb2 signaling inhibition at later larval stages. (A-D) 10 dpf Tg(myl7:H2B-EGFP); Tg(myl7:MKATE-CAAX) larvae after treatment with PD168393 from 72 to 84 hpf. Overall, little difference is observed between control and treated hearts, as can be seen from both optical sections (compare A' to B') and 3d surface renderings (compare A" to B"). The numbers of compact layer cardiomyocytes are similar, while the numbers of trabecular layer cardiomyocytes are slightly, although not significantly, increased (C) and the total numbers of cardiomyocytes are similar in both groups (D); each point represents a heart. (E-H) 1- dpf Tg(myl7:H2B-EGFP); Tg(myl7:MKATE-CAAX) larvae after treatment with PD168393 from 120 to 132 hpf. The trabeculae appear shorter and the trabecular mesh looks less developed than in control (compare E',E" to F',F"). The number of trabecular cardiomyocytes is slightly reduced in the treated larvae (G), but the total number of cardiomyocytes is similar (H); each point represents a heart. (I-J) Body length of 10 dpf larvae after treatment with PD168393 from 72 to 84 hpf (I) and from 120 to 132 hpf (J); each point represents a larva. Results are mean S.D., P=0.073 in G trabecular layer, *P=0.044 in J, Student's two-tailed t-test; experiment was repeated three times. Scale bars, 20 µm.