
|
Fig. S2
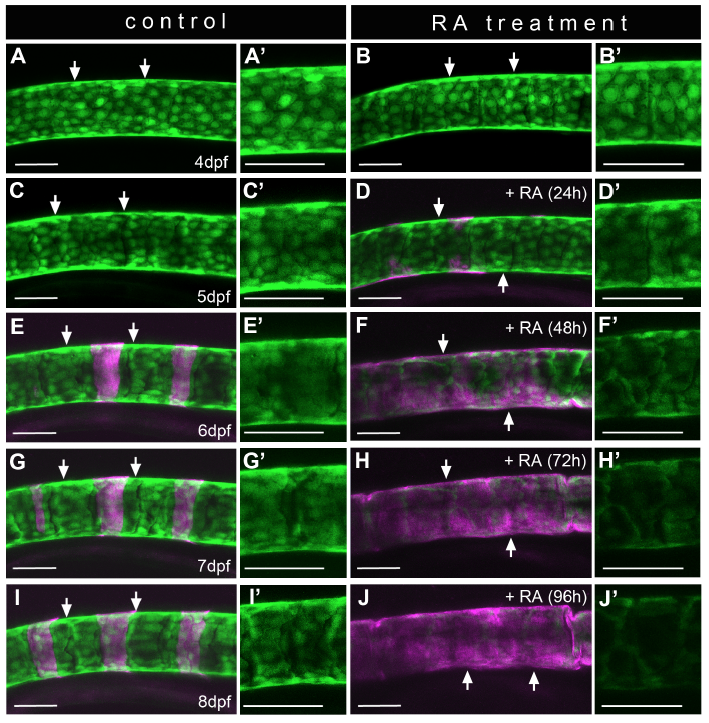
Down-regulation of Tg(R2-col2a1a:EGFP) expression and alterations in chordoblast morphology upon RA treatment are progressive processes
(A-J) Lateral views of notochords at the level of centra #2 to #4 in a representative control- (A,C,E,G,I; n=8) or RA-treated (B,D,F,H,J; n=12) Tg(R2-col2a1a:EGFP) larva in a time series over the indicated ages, anterior to the left; calcified extracellular matrix is labeled via Alizarin red (magenta). Time of RA incubation in the treated specimen (right column) is shown in brackets. Panels (A-J) show projections of confocal stacks with merged green and magenta channels. Panels (A’-J’) show single green channel projections of the corresponding area framed by the two arrows in (A-J). Scale bars represent 50μm. Note that the decrease in transgene expression is accompanied by a gradual change in chordoblast morphology, and that both processes occur in a progressive manner, with maximal effects only seen after three days of RA treatment.