
|
Fig. S3
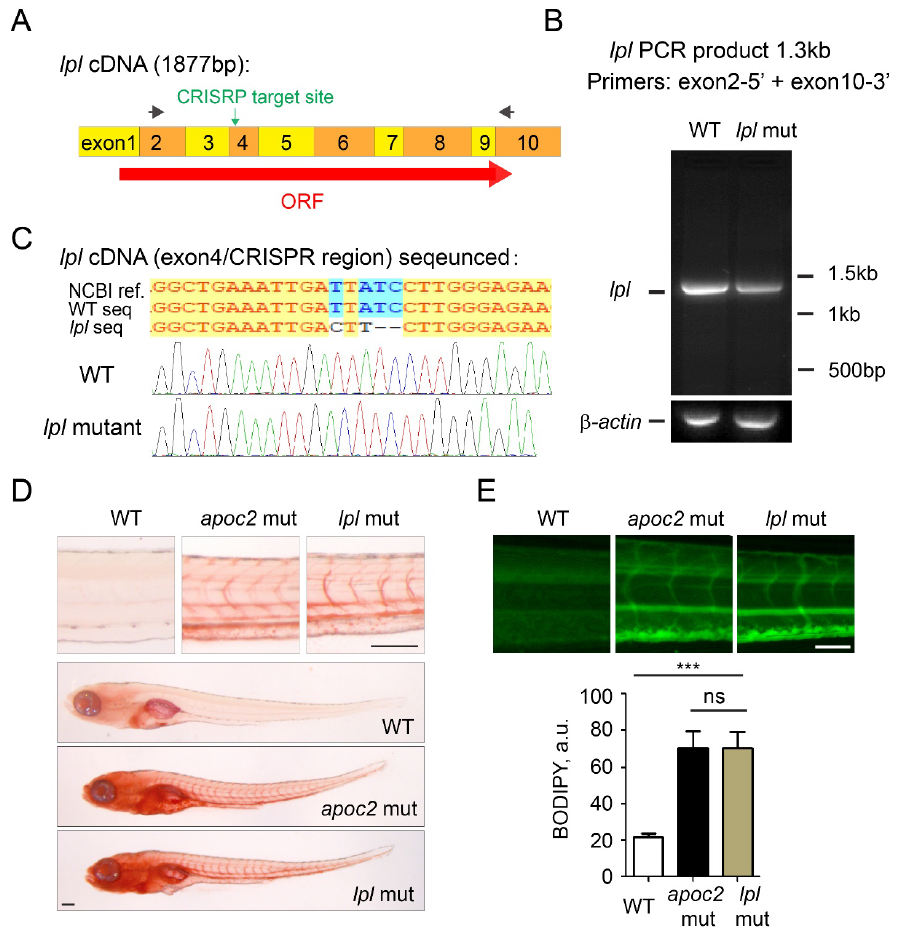
lpl mutants develop hyperlipidemia. (A) Primers, flanking exon 4, the site of CRISPR target, are used to amplify lpl cDNA. (B) Single lpl cDNA band of the same size in WT and lpl mutant embryos indicates that no alternative splicing occurs in the mutant. (C) Sequence results indicate a 2nt deletion in cDNA from lpl mutants. (D) ORO staining of WT, apoc2 and lpl mutants at 6 dpf. (E) Representative images and quantitative results of BODIPY neutral lipid staining of WT, apoc2 and lpl mutants at 6 dpf. Results are mean±SEM; n=5 (WT and apoc2 mut) and n=6 (lpl mut); ***P<0.001 (Student’s t-test). Scale bars, 100 μm in D, and 50 μm in E.