
|
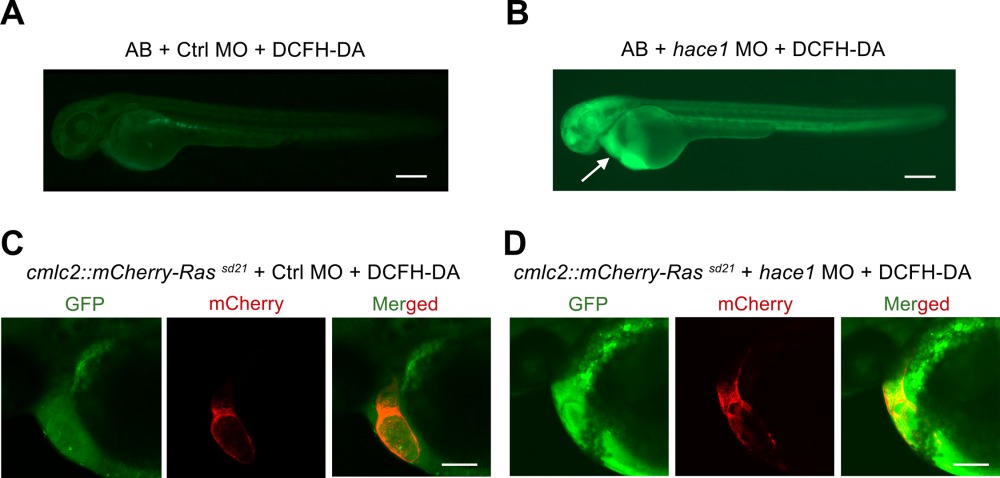
Fig. 4 ROS levels are elevated throughout the embryo and in particular in the heart following hace1 knockdown. ROS is labeled by green fluorescence generated with oxidation of 2',7'‐ DCFH‐DA. A: AB embryos injected with control morpholino demonstrate baseline levels of ROS in the whole organism. B: AB embryo following hace1 knockdown exhibits elevated levels of ROS throughout the embryo, in particular in cardiac structures (indicated by the white arrow). Scale bar = 250 µm for panels A and B. C: Confocal imaging of Tg(cmlc2::mCherry‐Ras)sd21 embryo injected with control morpholino demonstrates a normal two‐chamber heart in red with baseline levels of ROS. D: Confocal imaging of Tg(cmlc2::mCherry‐Ras)sd21 embryo injected with hace1 morpholino demonstrates a cardiac‐looping phenotype and accumulation of ROS in the heart. Scale bar = 100 µm for panels C and D. All embryos are 48 hpf and visualized laterally.