
|
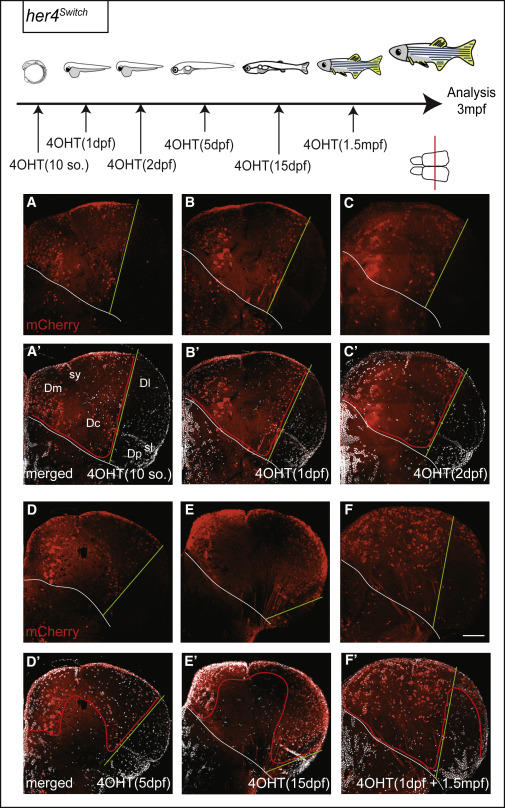
Fig. 4
Continuous Neurogenesis from the Pallial her4-Positive RG Population
Top: experimental design. Distribution of mCherry-positive neurons (A–F) born from RGs that were her4 positive at the time of 4OHT induction (stages at the bottom right of each panel). Cross-sections at 3 mpf are at identical mid-antero-posterior levels and the level is indicated by a red line on telencephalon dorsal view (A′–F′: mCherry and DAPI staining). Red lines indicate boundaries between territories with mCherry-positive and -negative neuronal cell bodies (mCherry is cytoplasmic in the ubi:switch line [3535], and thus also stains processes). White lines indicate pallial-subpallial boundaries. Green lines delimit the recombined (Dm, medial part of Dl) and un-recombined (lateral part of Dl, Dp) pallial territories in her4switch animals treated with 4OHT (see [2121]; at any given time point, all pallial RGs are her4 positive [Figure S2Figure S2]; however, the pallial VZ expands laterally over time through the addition of RGs originating from a her4-negative source; therefore, the green lines shift toward the lateral with later recombination times). The her4switch fish in (F) and (F′) was subjected to two consecutive inductions, at 1 dpf (medial neurons only, left to green bar limit) and then at 1.5 mpf (superficial neurons, right to green bar limit). Scale bar, 50 μm.