
|
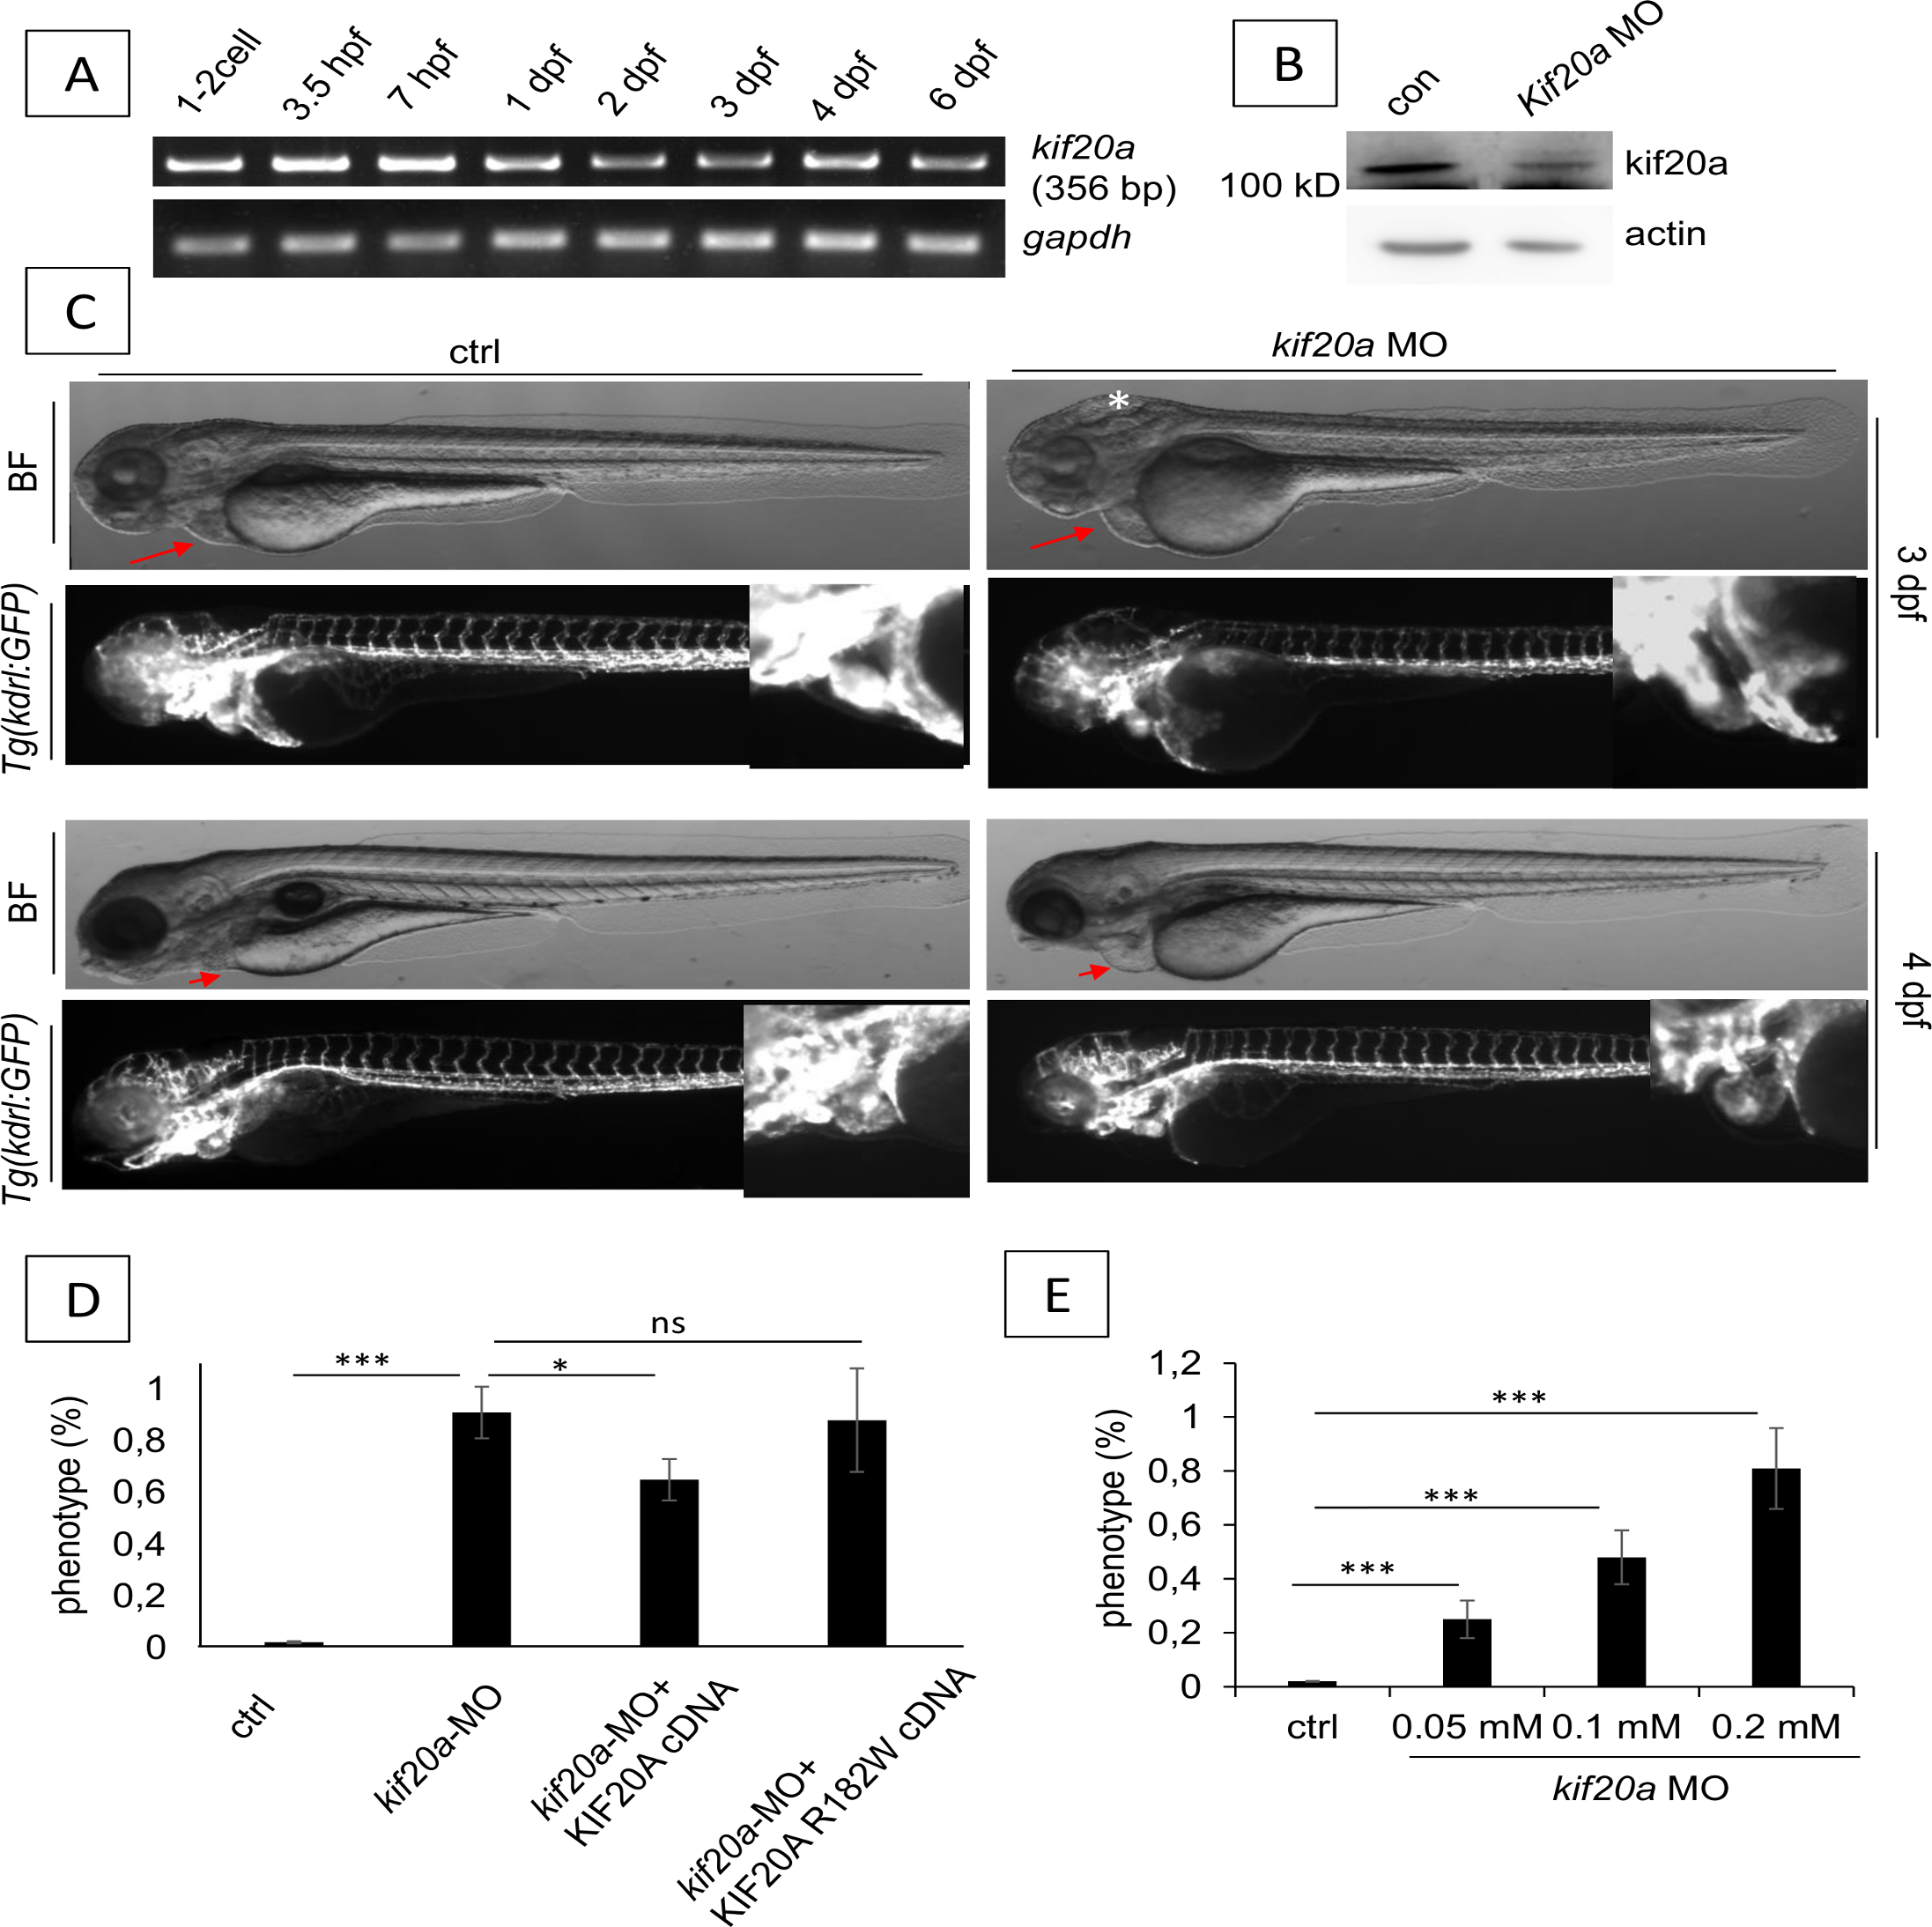
Fig. 5
Zebrafish kif20a knockdown studies.
(A) RT-PCR analysis of zebrafish kif20a gene expression during early stages. Gapdh was used as a housekeeping gene. (B) Western blot analysis of whole lysates from control and kif20a morphants showing a 74% protein reduction. Actin was used as a loading control. (C) Morphological analysis of zebrafish control and kif20a morphants at 3–4 dpf. Upper panel: Bright-field and fluorescence images of zebrafish control and kif20a morphants at 3 dpf. The white star indicates cerebral oedema in the morphants, the red arrows indicate the cardiac region where cardiac oedema is pronounced in the morphants and absent in controls. Lower panel: Bright-field and fluorescence images of zebrafish control and kif20a morphants at 4 dpf. The red arrows indicate the cardiac region where cardiac oedema is pronounced in the morphants and absent in controls. (D) Rescue experiments where embryos were injected with kif20a-MO only, or co-injected with human KIF20A WT cDNA or KIF20A R182W cDNA. The percentage of cardiac phenotype in each groups at 3 dpf is presented. Data are represented as mean ± SD. Stars represent the results of one-way ANOVA-Dunnett’s post hoc test (*p<0.05, **p < 0.01, ***p<0.001, ns is not significant). (E) Dose dependent effect of kif20a-MO with varying concentrations of kif20a-MO (range 0–2 mM), injection dose was 4.6 nl. The percentage of cardiac phenotype at 3 dpf is shown.