
|
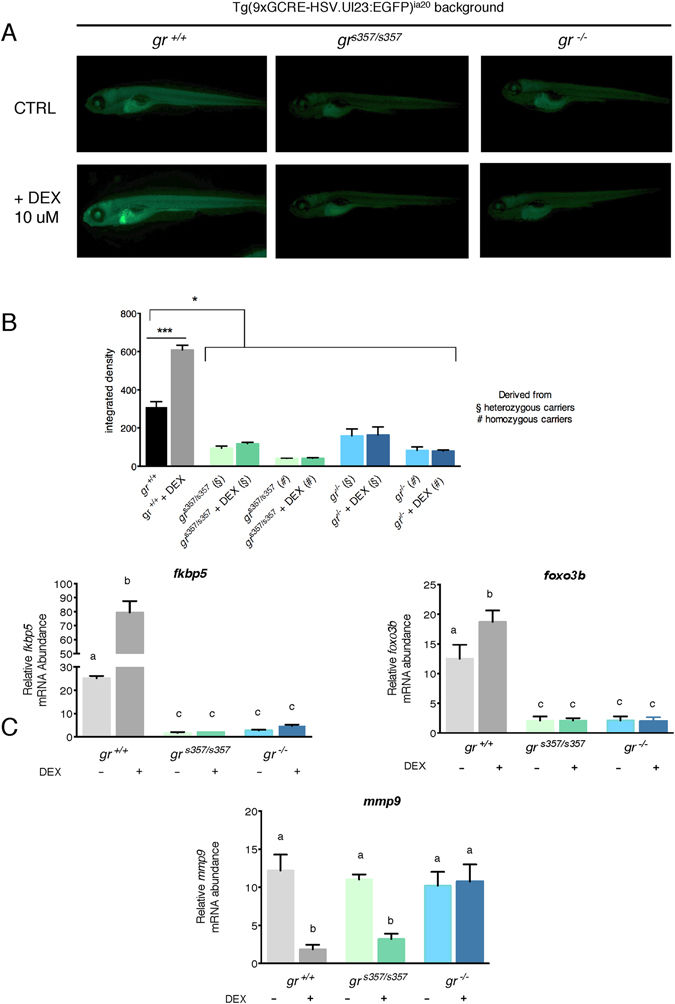
Fig. 3
gr s357/s357 and gr −/− 5-dpf zebrafish larvae in transgenic Tg(9xGCRE-HSV.Ul23:EGFP) background cannot respond to DEX treatment. (A) Fluorescence microscopy images of gr +/+, gr s357/s357 and gr −/− 5-dpf zebrafish larvae in transgenic Tg(9xGCRE-HSV.Ul23:EGFP)ia20 background. Treated larvae were subjected to 10 μM DEX treatment for 24 h (from 4 dpf to 5 dpf). (B) Integrated density analysis of fluorescence of 5-dpf zebrafish larvae of the three genotypes with or without DEX treatment. Homozygous zebrafish mutants deriving from heterozygous or homozygous parents were analysed separately. Values represent the mean ± SEM. Asterisks indicate that expression levels are significantly different from the control (two-way-ANOVA, *P < 0.05, ***P < 0.001). n = 15 larvae for each group. (C) qRT-PCR analysis of fkbp5, foxo3b and mmp-9 in gr +/+, gr s357/s357 and gr −/− 5-dpf zebrafish larvae deriving from homozygous parents with or without DEX treatment. Values represent the mean ± SEM. Different letters indicate statistically significant differences checked by two-way ANOVA followed by Tukey’s multiple-comparison test. fkbp5 (P < 0.01); foxo3b and mmp-9 (P < 0.001). Data were generated from four biological replicates.