
|
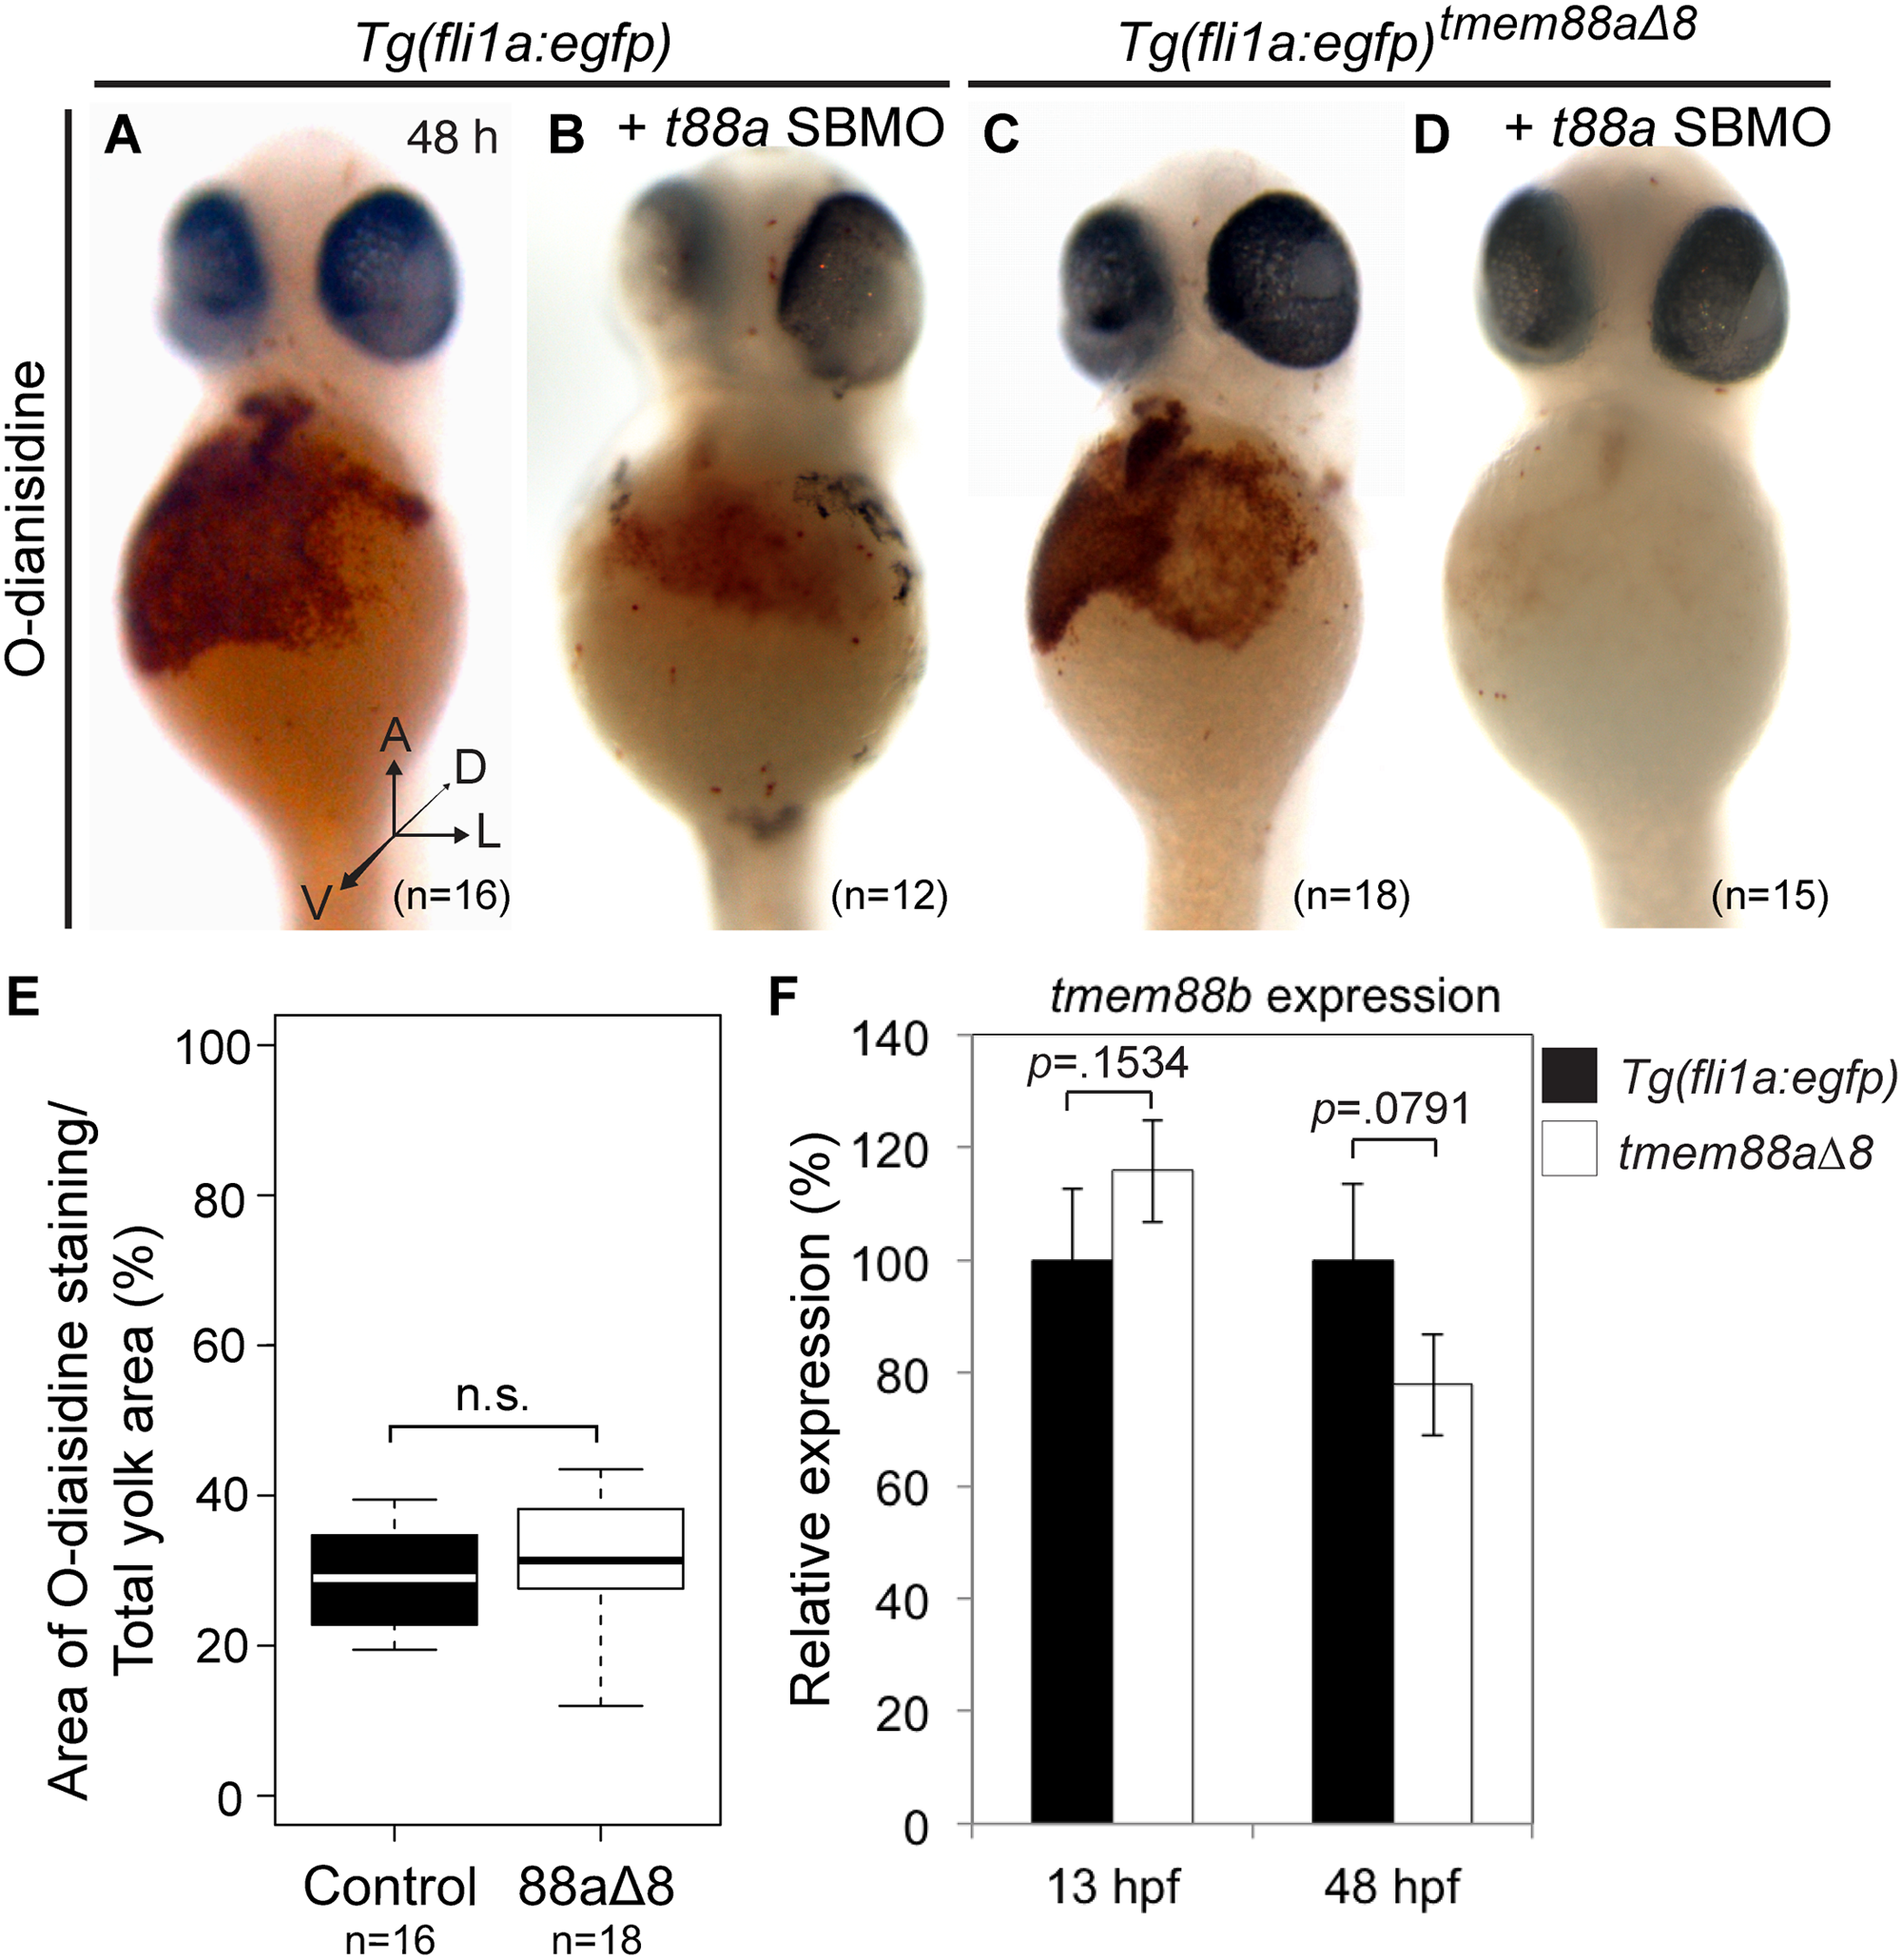
Fig. 7
Erythropoiesis was not affected in tmem88aΔ8 zebrafish mutants.
(A-D) o-Dianisidine staining of erythrocytes at 48 hpf in uninjected Tg(fli1a:egfp) controls (A, n = 16) or controls injected with tmem88a SBMO (B, n = 12), and uninjected tmem88aΔ8 mutants (C, n = 18) or mutants injected with tmem88a SBMO (D, n = 15). (E) The area of o-Dianisine staining was quantified and presented as a percentage of the total yolk area, shown in a Tukey box and whisker plot. No significant difference was found between control embryos and tmem88aΔ8 mutants (p = 0.2710, Unpaired Student’s t test). (F) tmem88b expression is not affected in tmem88aΔ8 mutants. qRT-PCR showing the expression of tmem88b in tmem88Δ8 mutants compared to Tg(fli1a:egfp) controls at 13 and 48 hpf. P-value determined by Unpaired Student’s t test. Error bars denote the standard deviation of three biological replicates. A, anterior; h, hours post fertilisation; D, dorsal; L, lateral; V, ventral; n.s., not significant.