
Image
|
Figure Caption
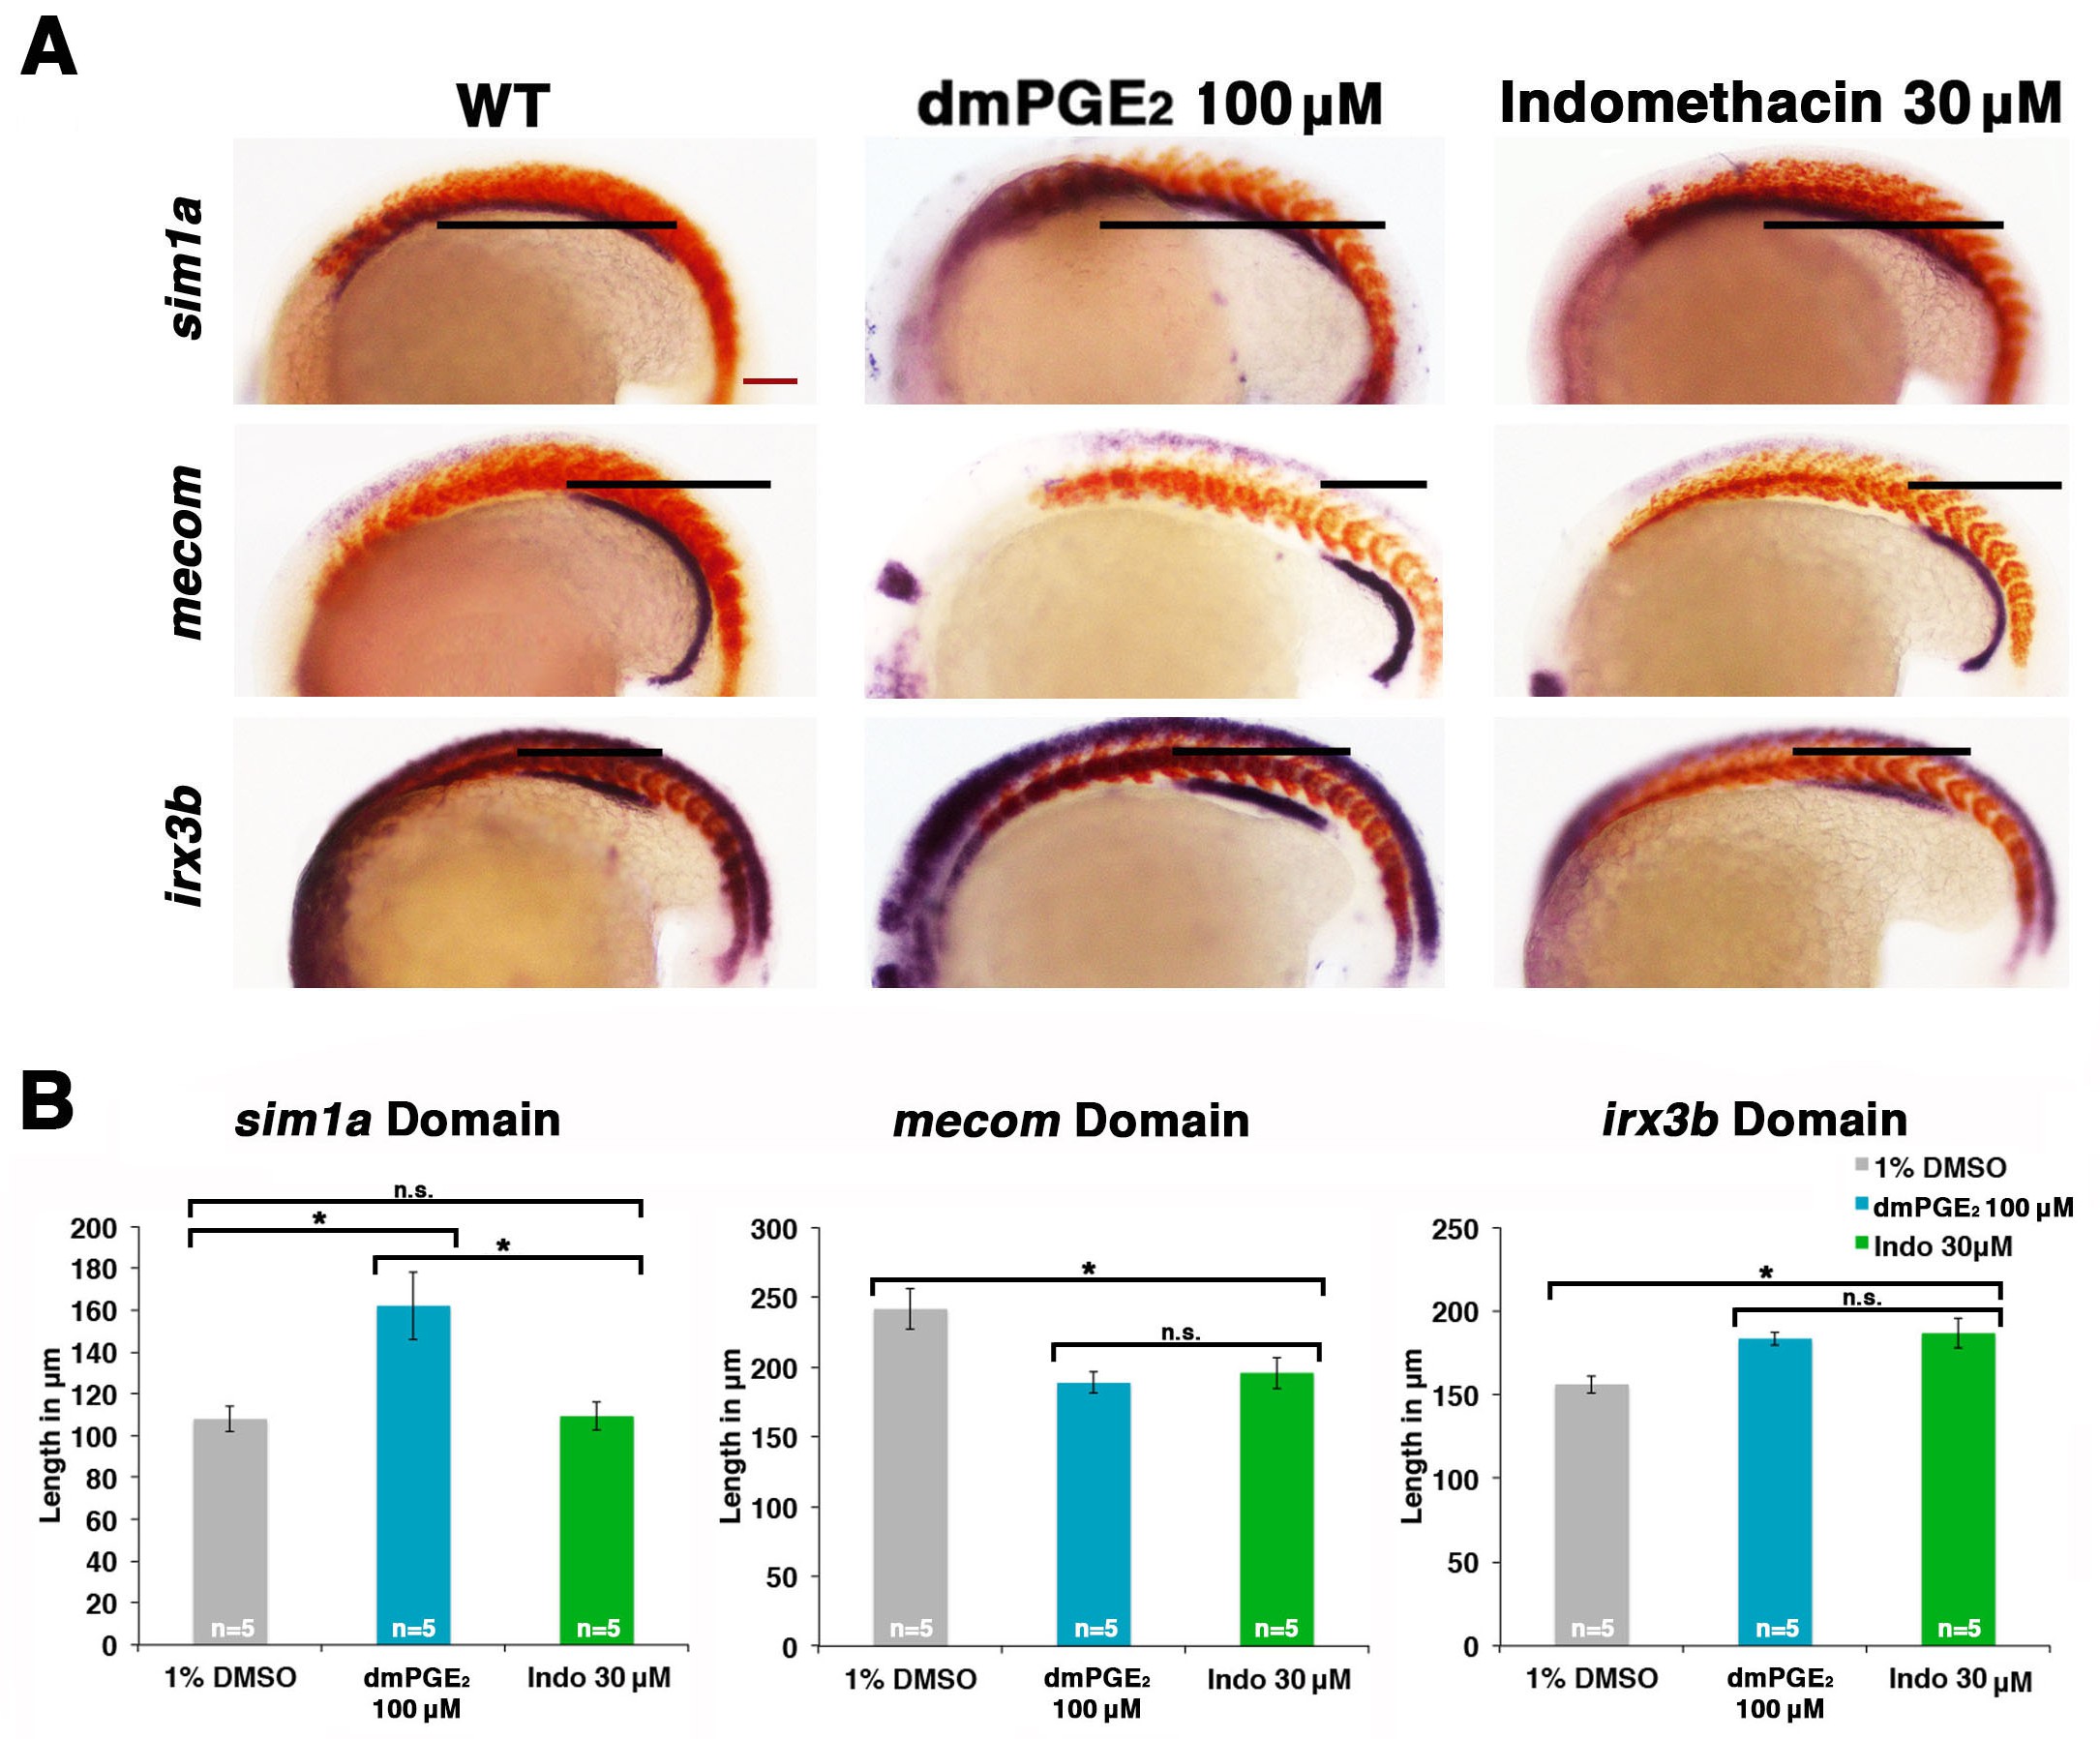
Fig. 6
Prostaglandin signaling modulates key nephrogenesis transcription factors.
(A) Embryos were treated with a 1% DMSO control, dmPGE2 at 100 μM, or indomethacin at 30 μM from 4 hpf to the 20 ss. WISH was used to stain for the transcription factors sim1a, mecom, and irx3b (purple) and the somites (red) at the 20 ss stage. Black bars indicate segment gene expression domain. Red scale bar, 70 µm. (B) The sim1a, mecom and irx3b domains were measured in microns (n = 5 for each control and experimental group). Data are represented as ± SD, ANOVA used to compare samples, *p<0.01, where n.s. indicates not significant.
Acknowledgments
This image is the copyrighted work of the attributed author or publisher, and
ZFIN has permission only to display this image to its users.
Additional permissions should be obtained from the applicable author or publisher of the image.
Full text @ Elife