
|
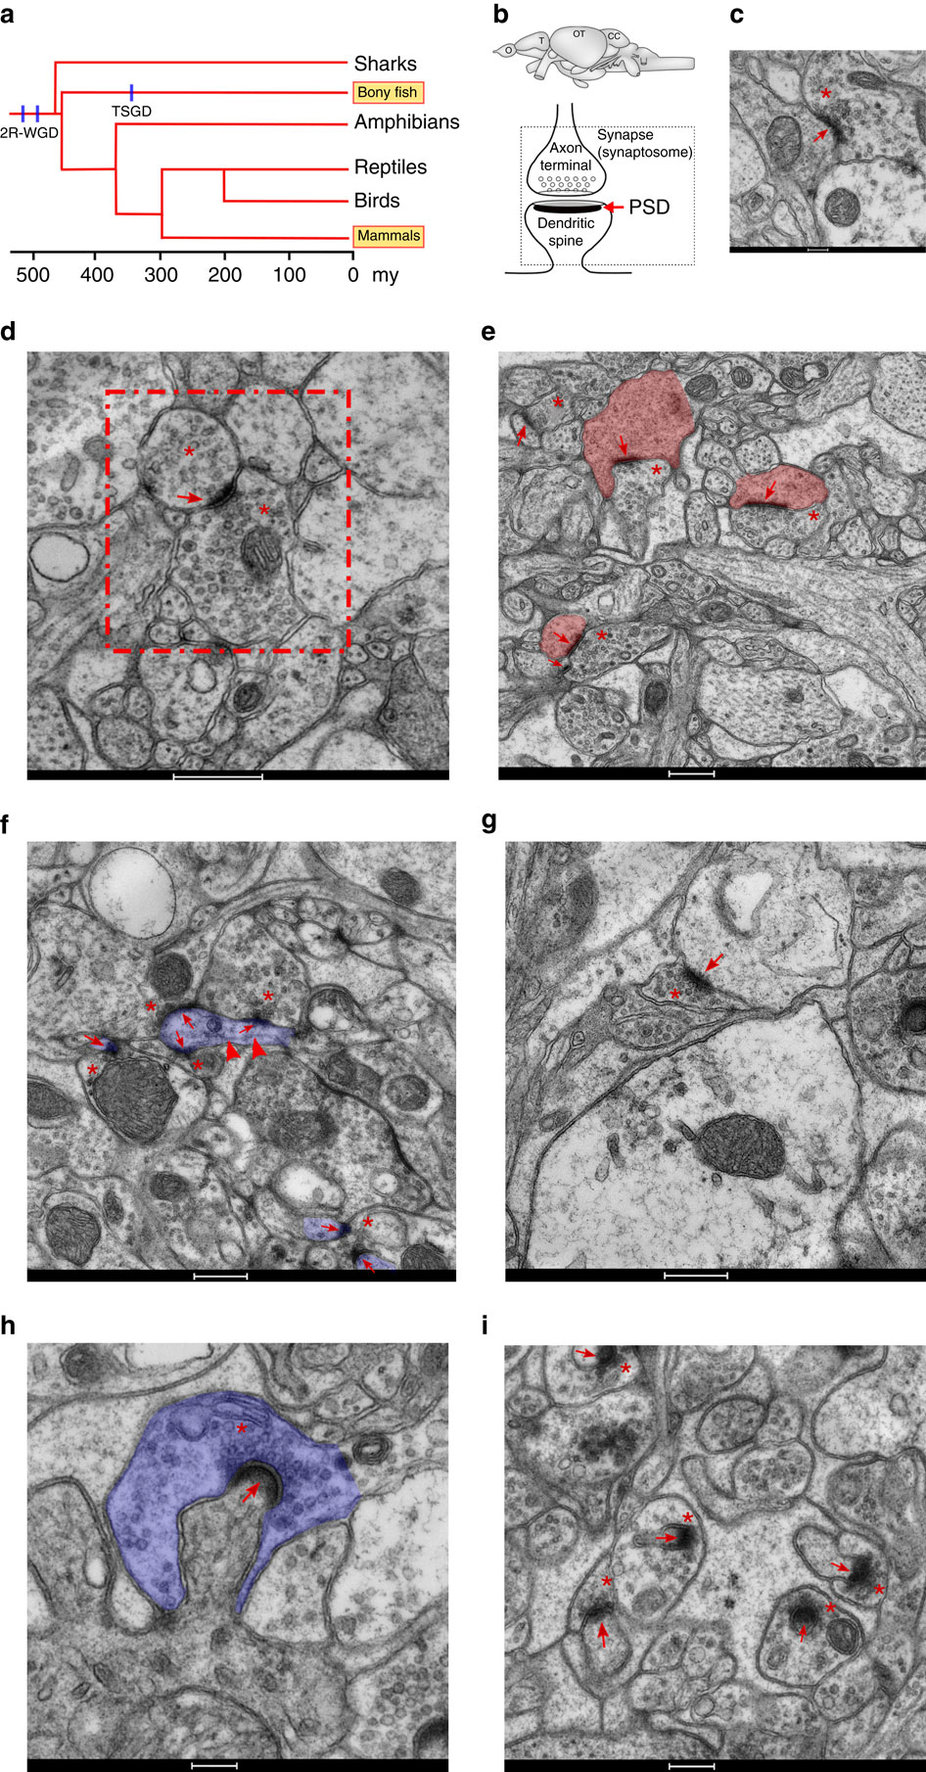
Fig. 1
Transmission electron microscopy of zebrafish asymmetric synapses in four different brain areas.
(a) Evolutionary tree of the vertebrate lineage with timescale in million years (my). The occurrence of the two WGD events common to all vertebrates (2R-WGD) and specific to teleosts (TSGD) are indicated by blue lines. (b) Schematic representation of the zebrafish brain with the four regions studied (CC, cerebellar corpus; O, olfactory bulb; OT, optic tectum; T, telencephalon) and of an excitatory synapse. Synaptosomes are formed by the axon terminal and the dendritic spine, which are separated from their corresponding neurons during tissue processing. The location of the PSD is also indicated. (c) Asymmetric synapse from the olfactory bulb. A red asterisk and a red arrow indicate the location of presynaptic vesicles and the PSD, respectively. Scale bar, 200 nm. (d) An asymmetric dendrodendritic synapse of the olfactory bulb (framed by a red dotted square) is shown. Asterisks indicate pre- and post-synaptic vesicles. The PSD is indicated by a red arrow. Scale bar, 500 nm. (e) Asymmetric synapses from the telencephalon. Red asterisks and arrows indicate the location of presynaptic vesicles and PSDs, respectively. The area corresponding to postsynaptic spine-like structures is filled with pink. Scale bar, 500 nm. (f) Asymmetric synapses from the optic tectum. Red asterisks and arrows indicate the location of presynaptic vesicles and the PSD, respectively. Red arrowheads indicate microtubule location within thin dendritic-like projection. The area of a thin dendritic-like projection, where synapses are formed, is filled with purple. Scale bar, 500 nm. (g) Flat (standard) asymmetric synapse from the cerebellar corpus. A red asterisk and a red arrow indicate the location of presynaptic vesicles and the PSD, respectively. Scale bar, 500 nm. (h) Asymmetric synapse from the medial part of the cerebellar corpus showing the extent at which the presynaptic element (highlighted in purple) surrounds the dendritic spine. Scale bar, 200 nm. (i) Micrograph displaying the morphology of most abundant asymmetric synapses from the cerebellar corpus. Red asterisks and arrows indicate the location of presynaptic vesicles and the PSD, respectively. Scale bar, 500 nm.