
Fig. 7
|
Fig. 7
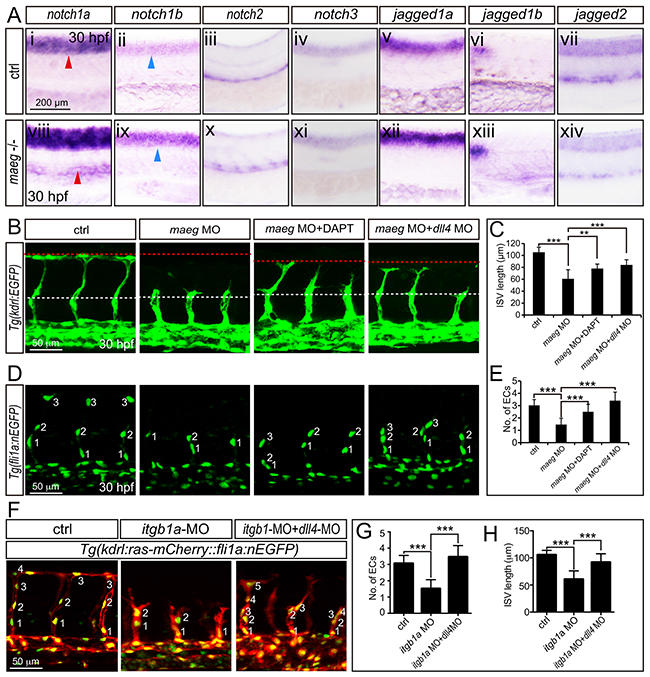
The phenotype of maeg and itgb1 loss-of-function involves Notch signaling. A. Whole mount in situ hybridization analysis of zebrafish embryos using antisense notch1a, notch1b, notch2, notch3, jag1a, jag1b, and jag2b probes. 30 hpf, lateral view. Blue arrowheads indicate the notochord position. Red arrowheads indicate the trunk vessel position. B. Confocal images of ISVs in control embryos, maeg morphants, maeg morphants treated with DAPT, and maeg morphants coinjected with dll4 MO using Tg(kdrl:EGFP) transgenic embryos. The red and white dash lines indicate the position of dorsal roof and horizontal myoseptum respectively. C. The statistics of ISV length in 30 hpf control embryos, maeg morphants, maeg morphants treated with DAPT, and maeg morphants coinjected with dll4 MO. One-Way ANOVA; ***,P<0.001. D. Confocal imaging analysis of endothelial numbers of ISVs in 30 hpf control embryos, maeg morphants, maeg morphants treated with DAPT, and maeg morphants coinjected with dll4 MO using Tg(fli1a:EGFP) transgenic embryos. Nuclei of ISVs are numbered. E. Quantification of ECs nuclei number in ISV. Measurements were made from three adjacent ISVs (over yolk) per embryo from 3 independent experiments. One-Way ANOVA; ***,P<0.001. F. Confocal images of ISVs in control embryos, itgb1a morphants, and itgb1a morphants coinjected with dll4 MO using Tg(kdrl:ras-mCherry::fli1a:nEGFP) transgenic line at 30 hpf. G. Quantification of ECs nuclei number in ISV. Measurements were made from three adjacent ISVs (over yolk) per embryo from 3 independent experiments. One-Way ANOVA; ***,P<0.001. H. The statistics of ISV length. One-Way ANOVA; ***,P<0.001.