
Fig. 1
|
Fig. 1
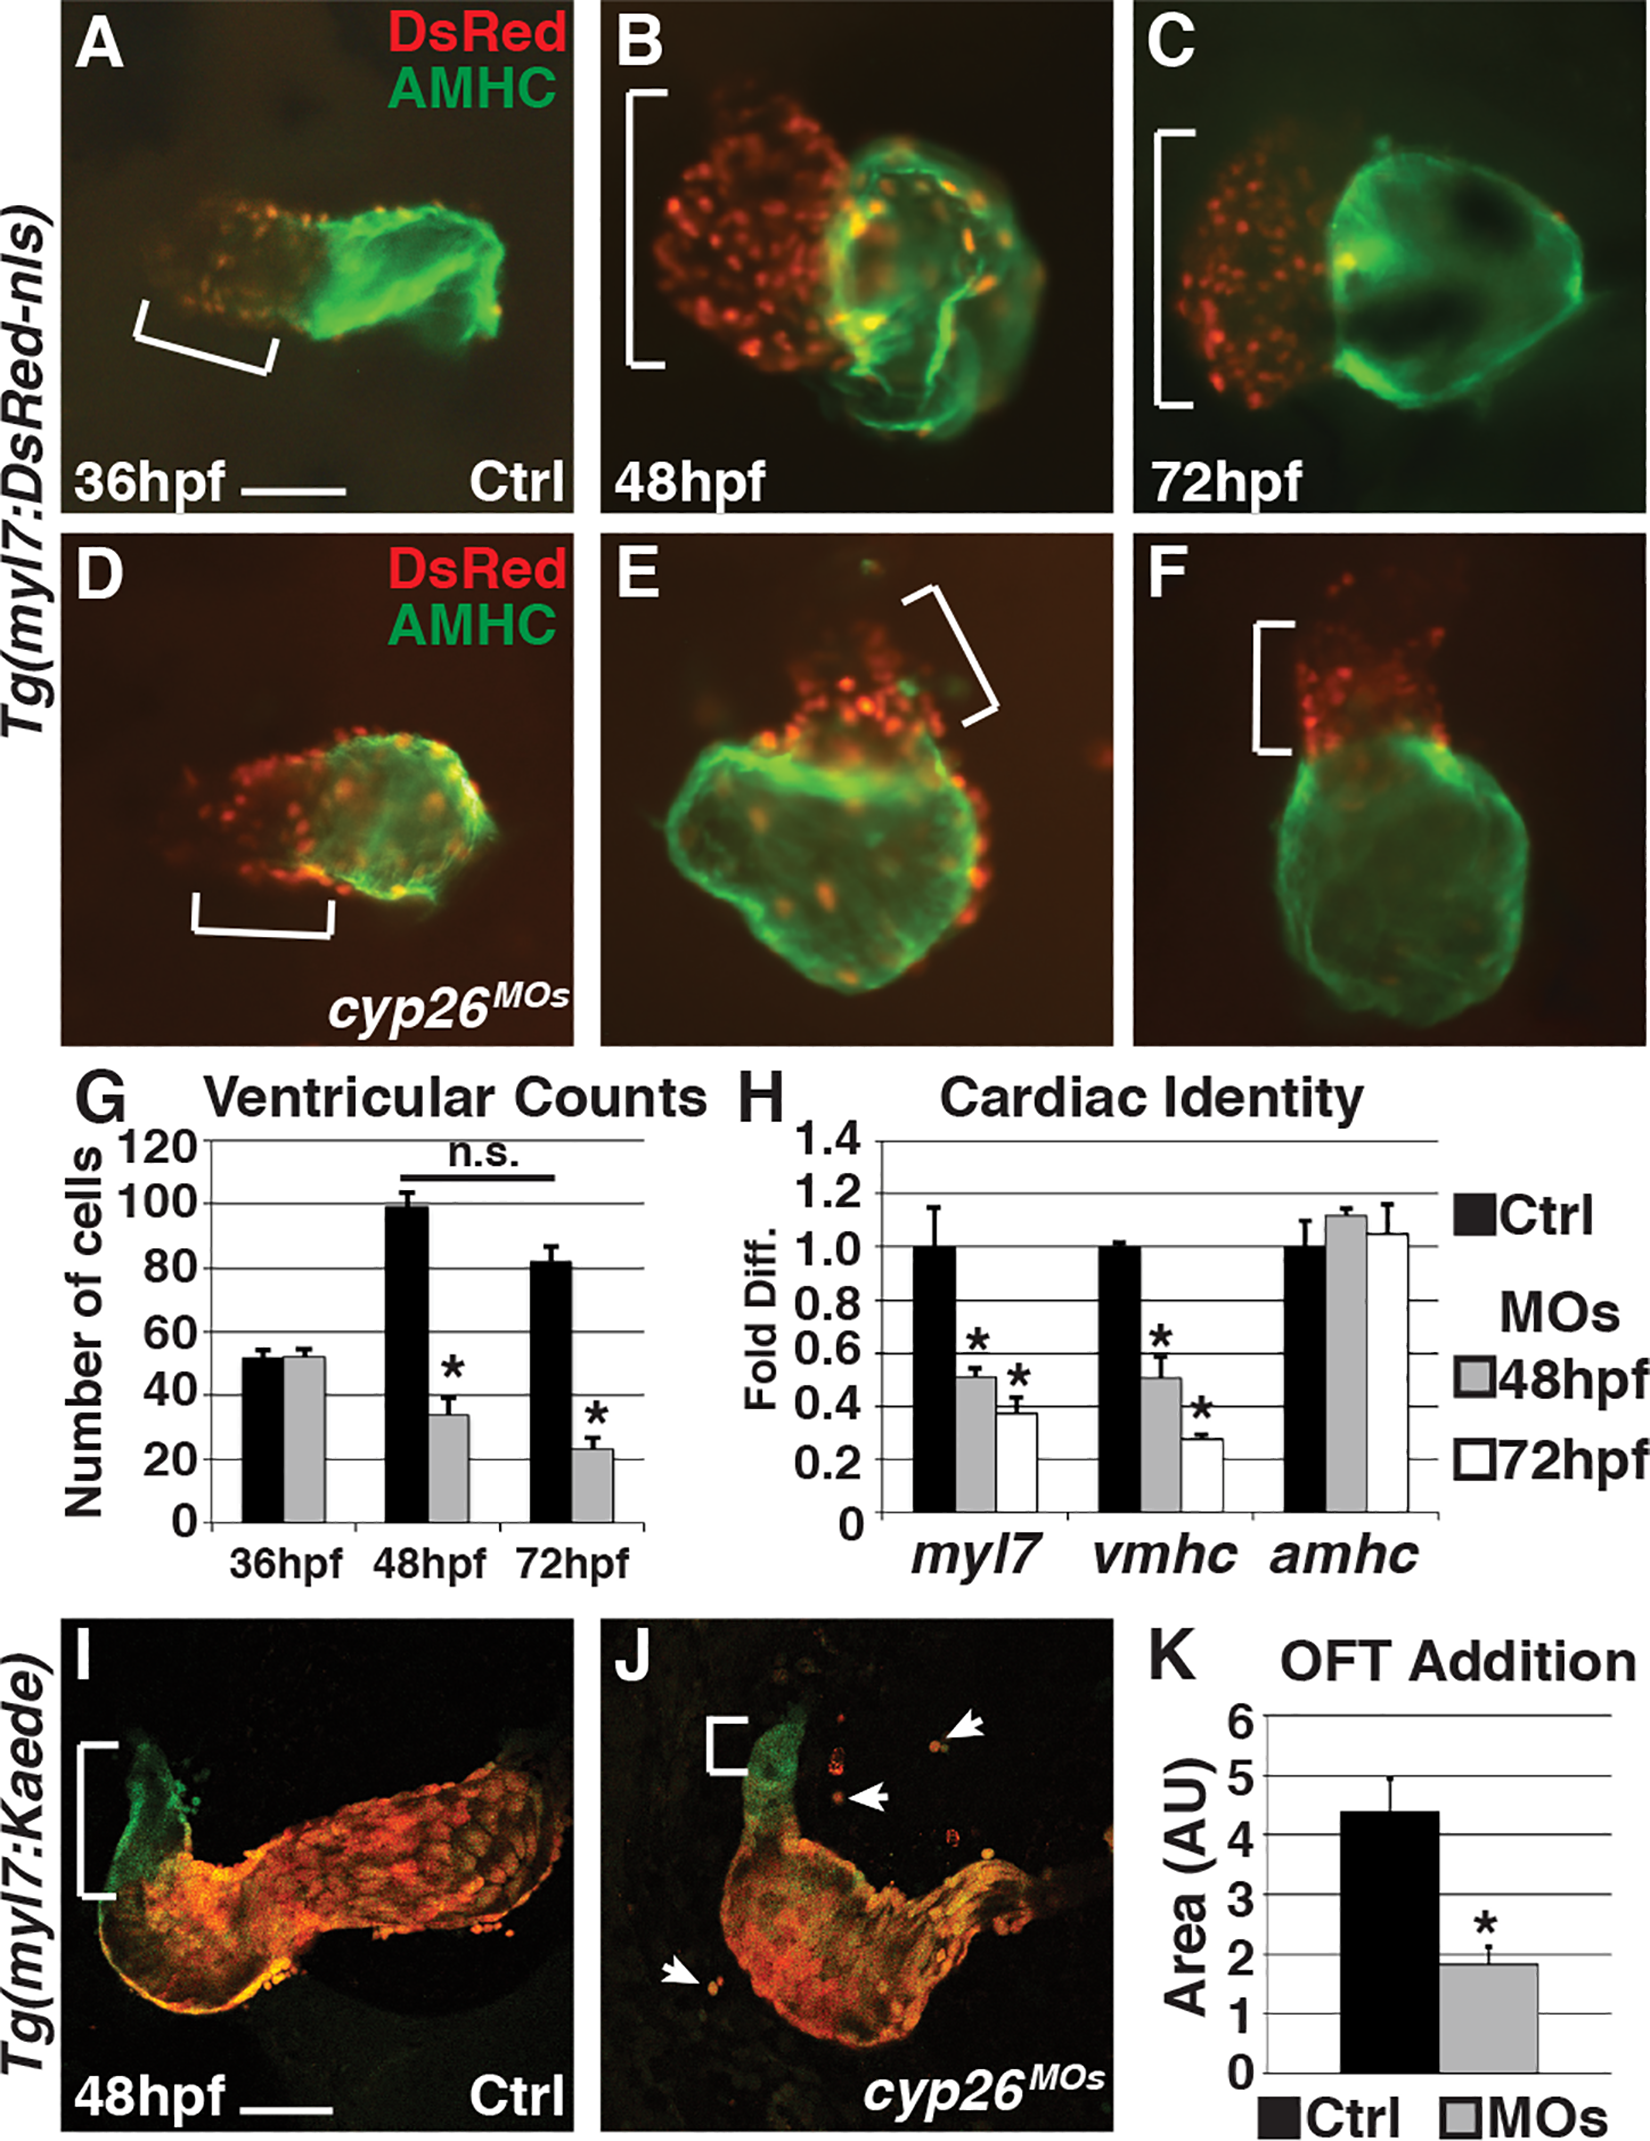
Cyp26-deficient embryos fail to add ventricular cardiomyocytes.
(A–F) Control (Ctrl) and Cyp26-deficient Tg(myl7:DsRed2-NLS) embryo hearts at 36 (A,D), 48 (B,E), and 72 hpf (C,F). Ventricles are red only (brackets) and atria are green (AMHC immunostaining). (G) Graph indicating cardiomyocyte counts at 36 (n = 10 for control and n = 8 for Cyp26 deficient), 48 (n = 15 per group) and 72 hpf (n = 15 per group). (H) Graph indicating fold difference of mRNA relative to β-actin assayed with RT-qPCR for the cardiac differentiation markers myl7, vmhc, and amhc. (I,J) Confocal images of hearts from Tg(myl7:Kaede) embryos at 48 hpf that were photoconverted at 36 hpf. Brackets indicate ventricular addition (green only cells) to the hearts. Arrows denote cardiomyocytes outside of the heart tube. (K) Graph depicting quantification of the amount of ventricular addition to the OFT (n = 8 per group). Frontal views, anterior up (A–F); n > 20 embryos per group (A-F,I,J). Error bars are standard error of the mean (SEM), asterisks denote p < 0.05 compared to controls by Student’s t test. Scale bar: 50 μm.