
Image
|
Figure Caption
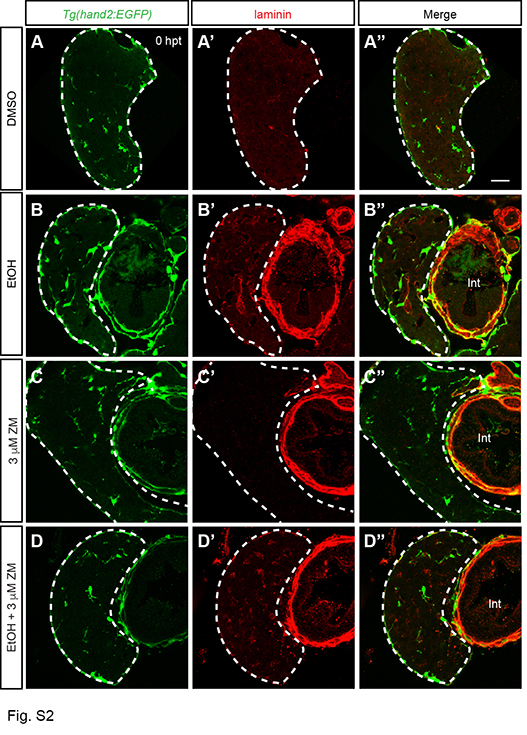
Fig. S2
Larvae that were co-treated with VEGFR inhibitor and ethanol from 96 to 120 hpf still exhibited laminin deposition in the liver. (A-D) show HSCs marked by Tg(hand2:EGFP) expression; (A'-D') show laminin deposition; (A''-D'') are the merged images of the two. (A-D'') Confocal single plane images from the vibratome transverse sections are shown. 10 larvae were examined in each experimental group. Dashed line marks the liver. Scale bar, 20 μm. Int, intestine.
Acknowledgments
This image is the copyrighted work of the attributed author or publisher, and
ZFIN has permission only to display this image to its users.
Additional permissions should be obtained from the applicable author or publisher of the image.
Full text @ Dis. Model. Mech.