
Fig. 5
|
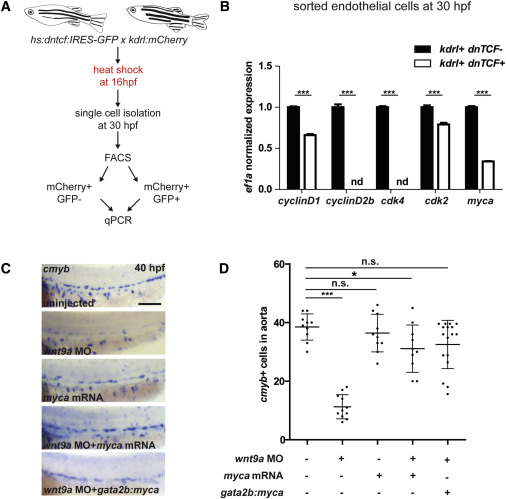
Fig. 5
Wnt9a Affects Endothelial gata2b+ G1-S Cell Cycle Progression through myca
(A) Endothelial cells (mCherry+) were collected by FACS from hs:dntcf:IRES-GFP; kdrl:mCherry fish at 30 hpf after heat shock at 16 hpf (n = 100 embryos per condition).
(B) Wnt inhibited (dntcf;GFP+) cells were compared to control (GFP−) cells by qPCR after being sorted by FACS.
(C and D) AB∗ fish were injected with wnt9a MO, myca mRNA, or both; phldb4:Gal4 fish were injected with wnt9a MO, UAS;myca plasmid, and transposase mRNA, fixed at 40 hpf, analyzed by WISH for cmyb (C), and quantified in (D).
Scale bar, 100 μm. ∗p < 0.05; ∗∗∗p < 0.001; n.s., not significant. Error bars represent SD. See also Figure S5.