
|
Fig. 1
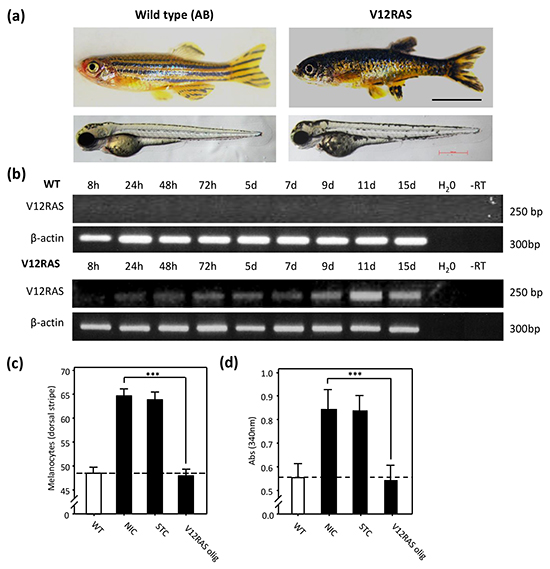
Melanocyte hyplerplasia in V12HRAS-expressing zebrafish embryos. a. Upper pictures: WT (left) and V12RAS (right) transgenic adult fish. Lower pictures: 5dpf embryos. b. Expression of exogenous V12RAS detected by RT-PCR at different time points. β-catenin is a control for cDNA integrity. c. Quantification of the number of melanocytes in thirty wild-type (WT) or non-injected control (NIC), standard control oligonucleotide (STC)-injected or antisense oligonucleotide targeting exogenous V12RAS (V12RAS olig)-injected 5dpf V12RAS transgenic embryos. Shown are means ±SEM. d. Quantification of the melanin absorbance (λ= 340nm) for eight wild-type (WT) or NIC, STC-injected and V12RASolig-injected 5dpf V12RAS transgenic embryos. Shown are means ±SEM for six independent experiments. (c) and (d) For easier reference, the dashed line indicates the mean value for wild-type embryos. *** P<0.001 independent samples t-test.