
|
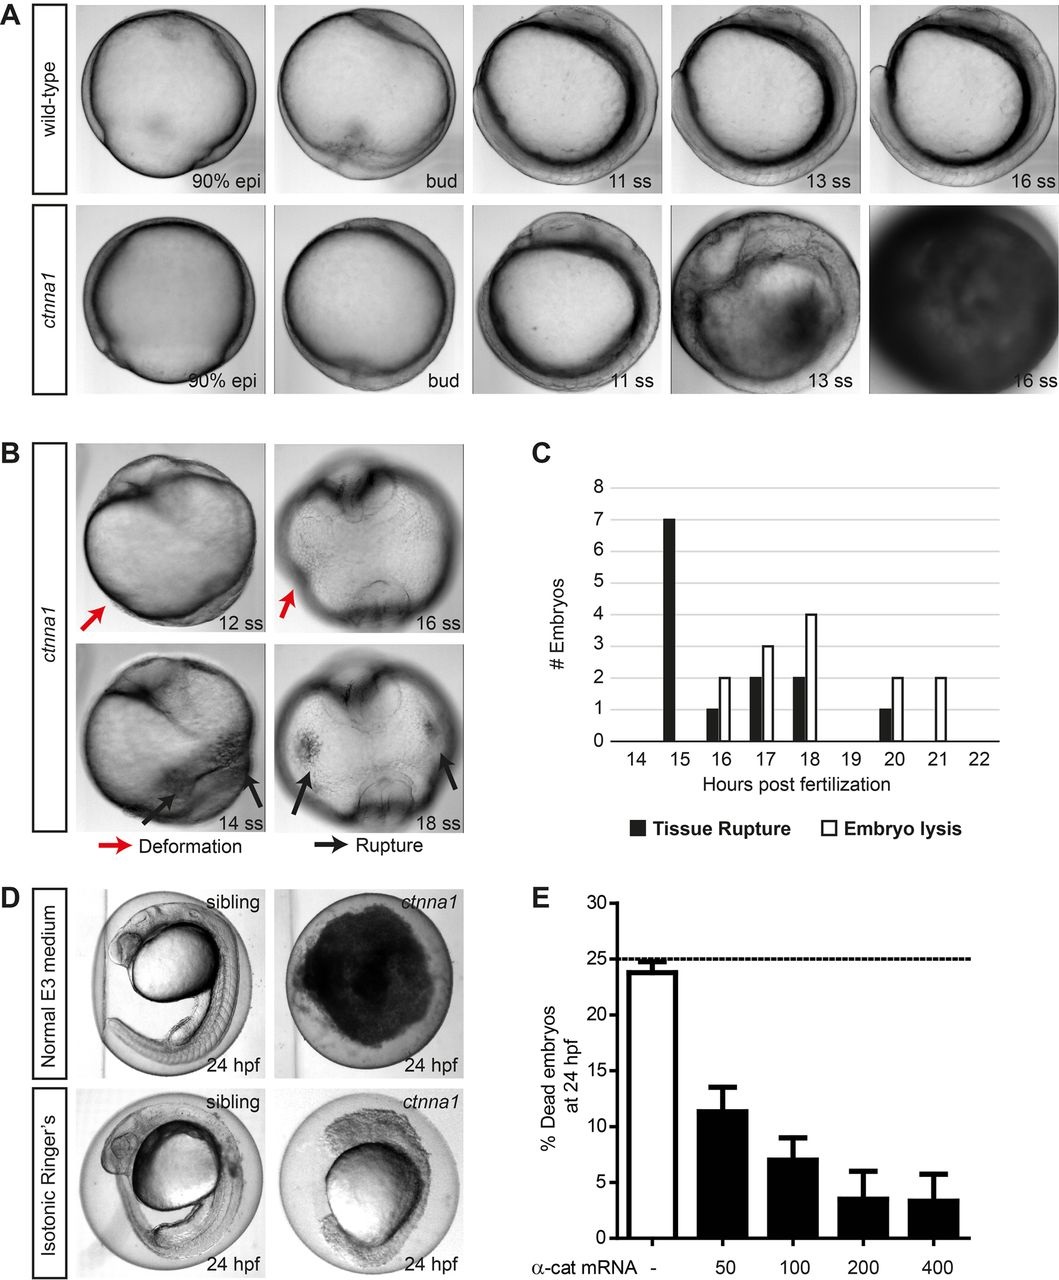
Fig. 2
Zygotic ctnna1 mutants show defects in epithelial barrier functioning. (A,B) DIC images from a time-lapse series of zygotic ctnna1 mutants and wild-type siblings imaged from 90% epiboly until 21 somite stage. Lateral view in (A) shows embryo lysis in zygotic ctnna1 mutants during somitogenesis. Anterior views of zygotic ctnna1 mutants in (B) show deformation (red arrows) and tissue rupture (black arrows) occurring before embryo lysis. (C) Quantification of the time of rupture and subsequent embryo lysis in zygotic ctnna1 mutants (n=13 embryos from three independent experiments). (D) Phenotype at 24 hpf of zygotic ctnna1 mutants and siblings grown in regular E3 medium, and embryos transferred to isotonic Ringer's buffer at 50% epiboly. (E) Rescue of embryo lysis in ctnna1 mutants using increasing concentrations of α-catenin-GFP mRNA. The dashed line indicates the expected mortality of non-injected incrossed heterozygous ctnna1 mutants based on Mendelian genetics. Data represent three independent experiments, n>120 embryos per condition. Data are represented as the mean±s.e.m.