
Fig. 2
|
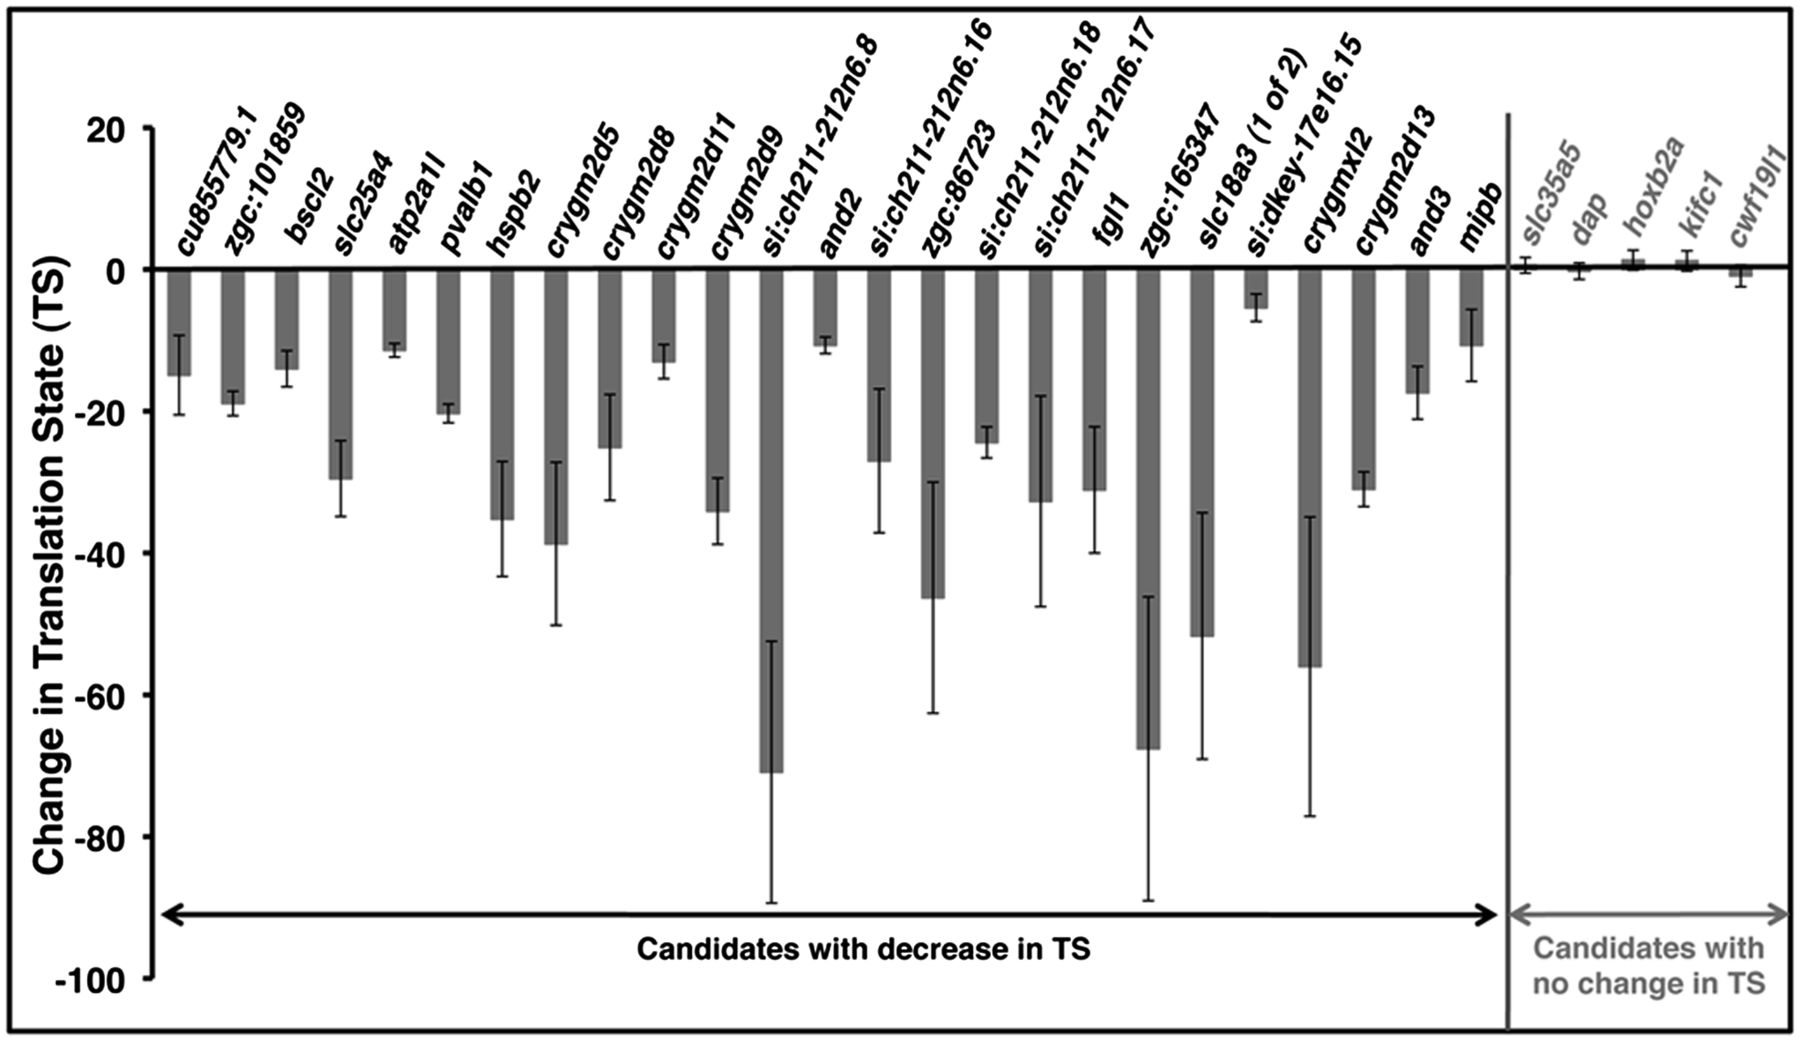
Fig. 2
Validation of the change in translation state for genes identified through RNA-seq. Shown are qPCR results from three independent biological isolates of both WT and eif3ha morphants for 25 genes that had been found to be decreased in translational state (TS) and five randomly chosen genes that had shown no change in TS. The bars represent the mean and the error bars the SEM. The change in TS has been calculated using the formula [(WT/MO)poly/[(WT/MO)total], where (WT/MO)poly and (WT/MO)total represent the changes of individual mRNAs in polysomal and total RNA, respectively. A negative sign is added arbitrarily to the calculated values to indicate that the translation efficiency is reduced in the morphants relative to WT. Actual data for each independent set, compared with the RNA-seq data, are presented in Table S2.