
IMAGE
Fig. 2
Image
|
Figure Caption
Fig. 2
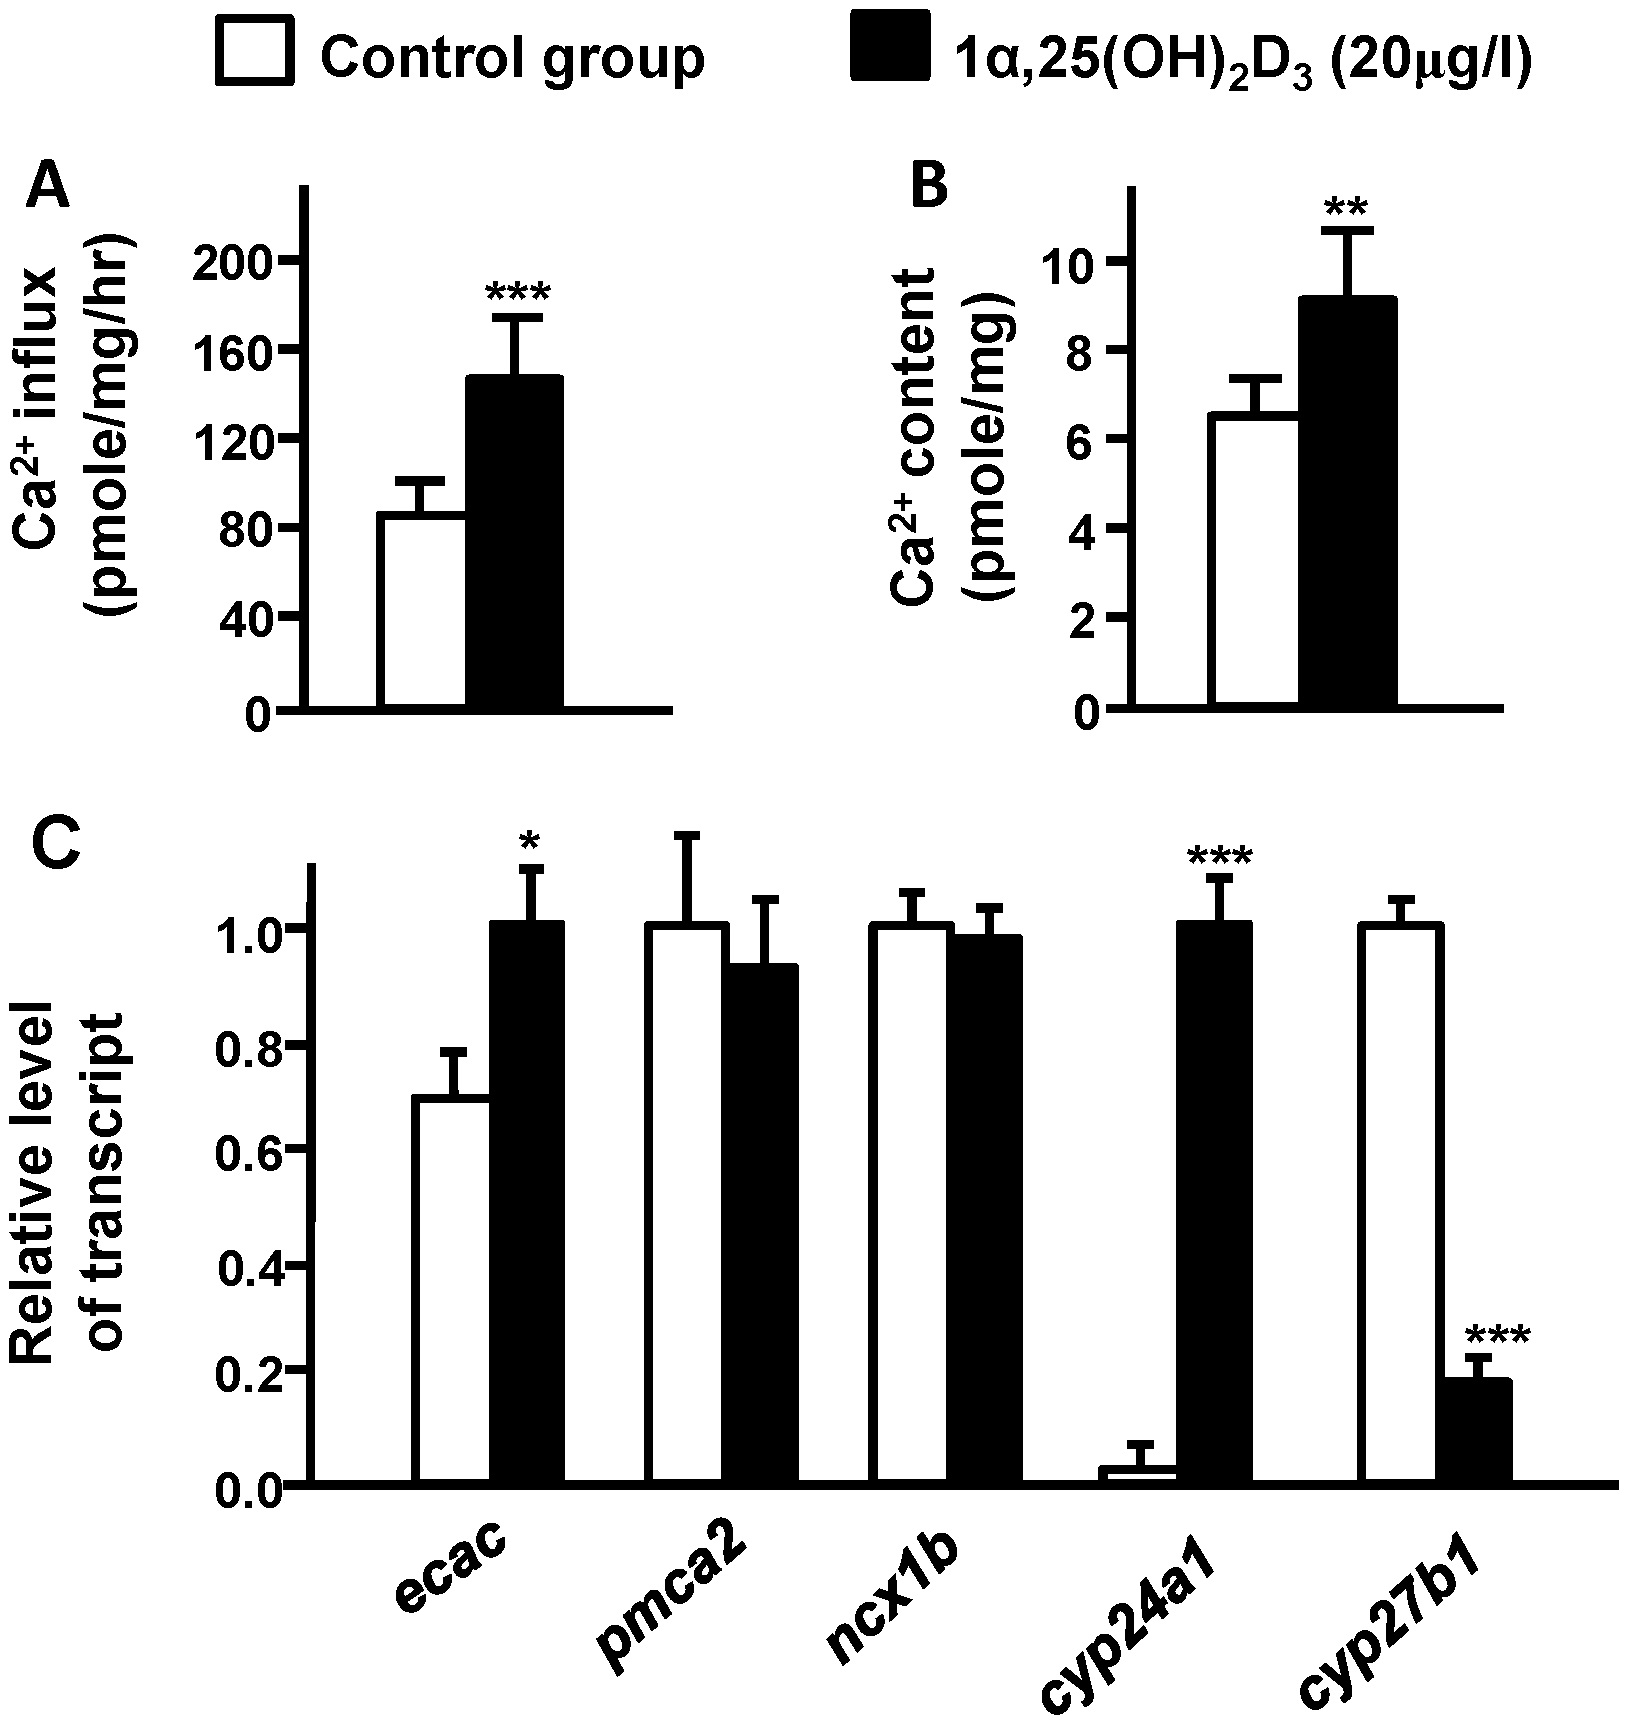
Effects of exogenous 1α,25(OH)2D3 (20 µg/l) in 3-d post-fertilization (dpf) zebrafish embryos.
Ca2+ influx (A), Ca2+ content (B), mRNA expressions in 3-dpf zebrafish embryos (C). mRNA expressions were analyzed by a qPCR, and values were normalized to β-actin. Values are the mean ± SD (n = 7~10). Student’s t-test, *p<0.05; **p<0.01, ***p<0.001.
Figure Data
Acknowledgments
This image is the copyrighted work of the attributed author or publisher, and
ZFIN has permission only to display this image to its users.
Additional permissions should be obtained from the applicable author or publisher of the image.
Full text @ PLoS One