
|
Fig. 3
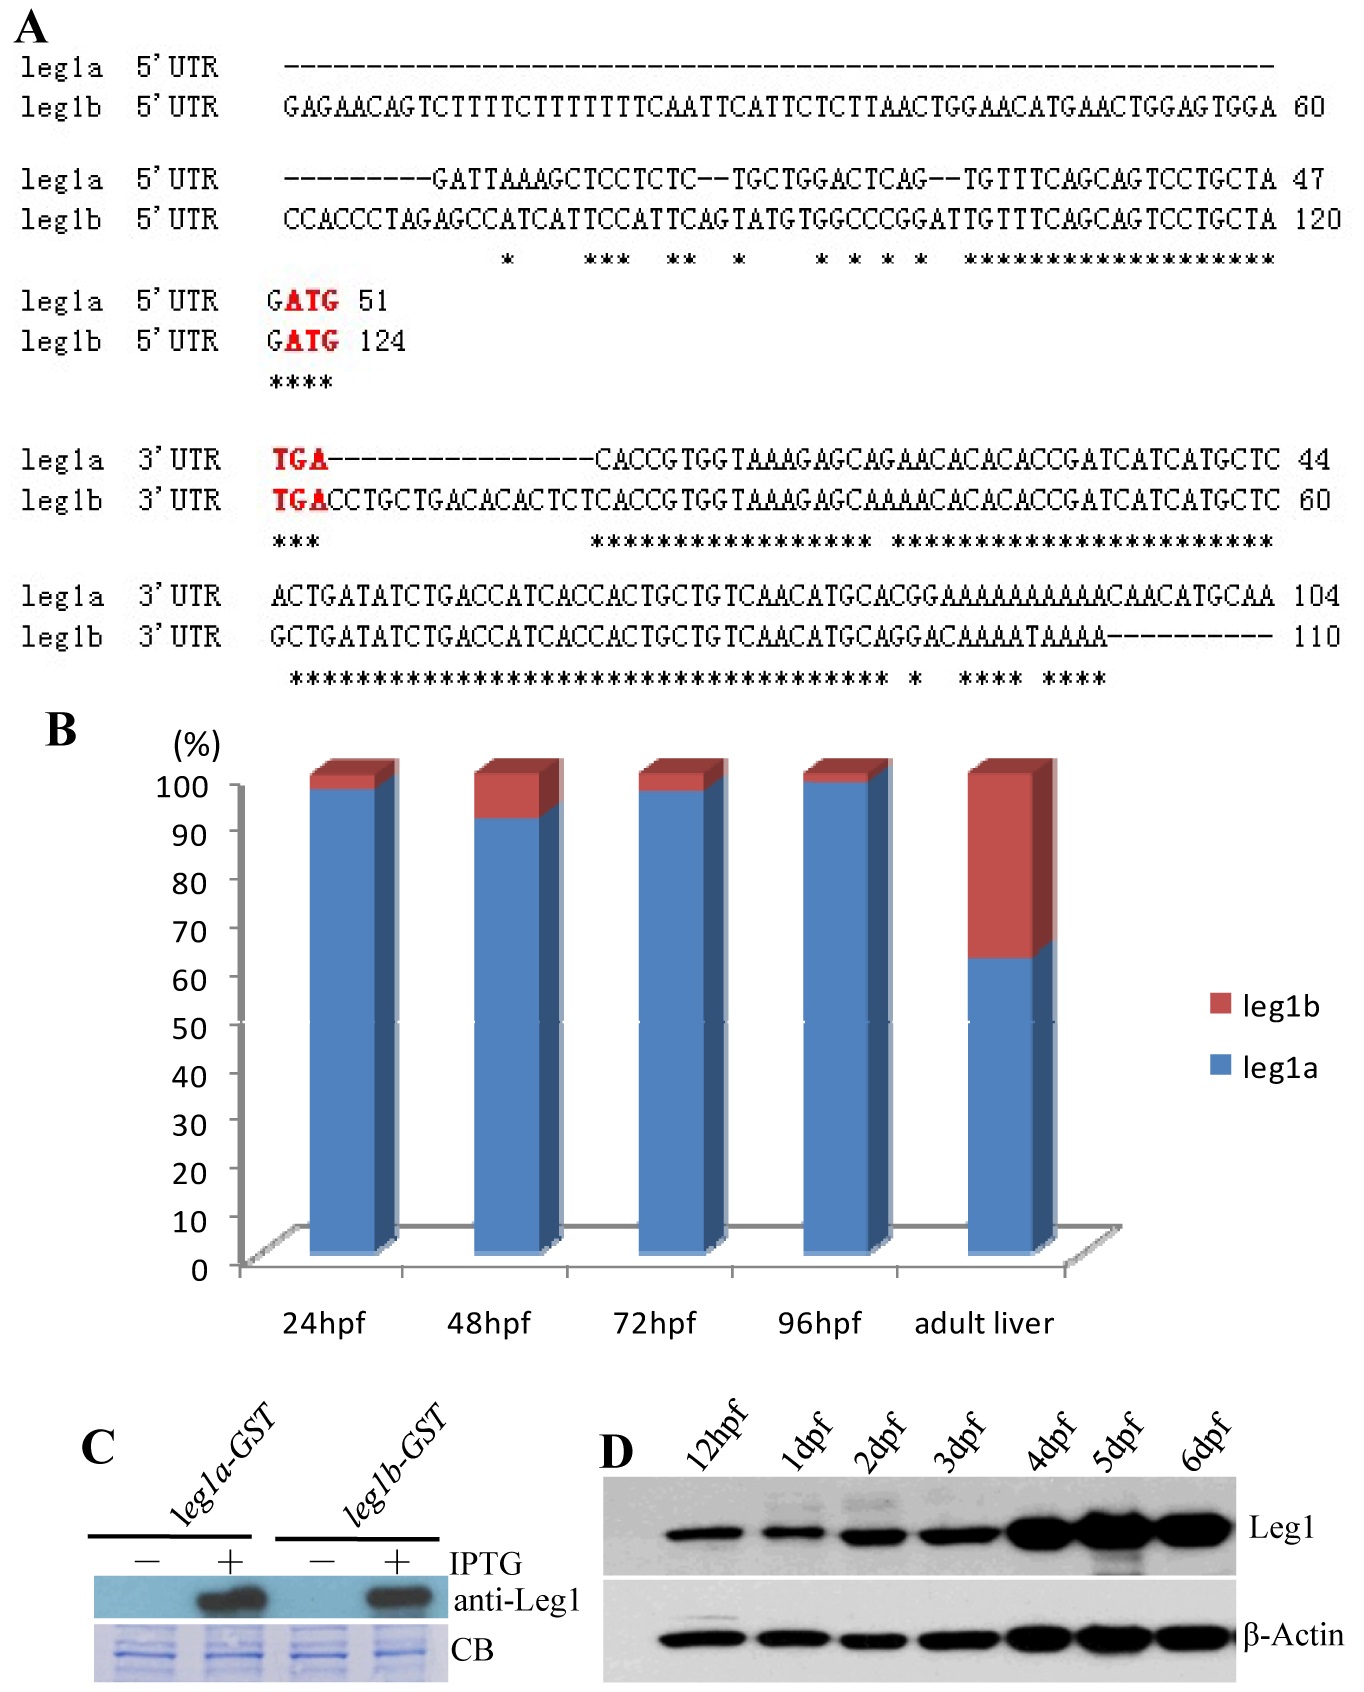
leg1a and leg1b are differentially expressed.
(A) Alignment of 5′- and 3′-UTRs of leg1a and leg1b transcripts, respectively. Asterisk highlights identical bases. Translation start codon ATG and stop codon TGA are lettered in red. (B) Comparison of leg1a and leg1b expression at different developmental stages as indicated. Data are presented in percentage (blue bar: leg1a; red bar: leg1b). (C) Anti-Leg1 monoclonal antibody recognizes both Leg1a and Leg1b which were induced to express in E. coli by isopropyl β-D-1-thiogalactopyranoside (IPTG). (D) Western blotting analysis of total Leg1 (Leg1a+Leg1b) expression in embryos at stages as indicated.