
IMAGE
Fig. 8
Image
|
Figure Caption
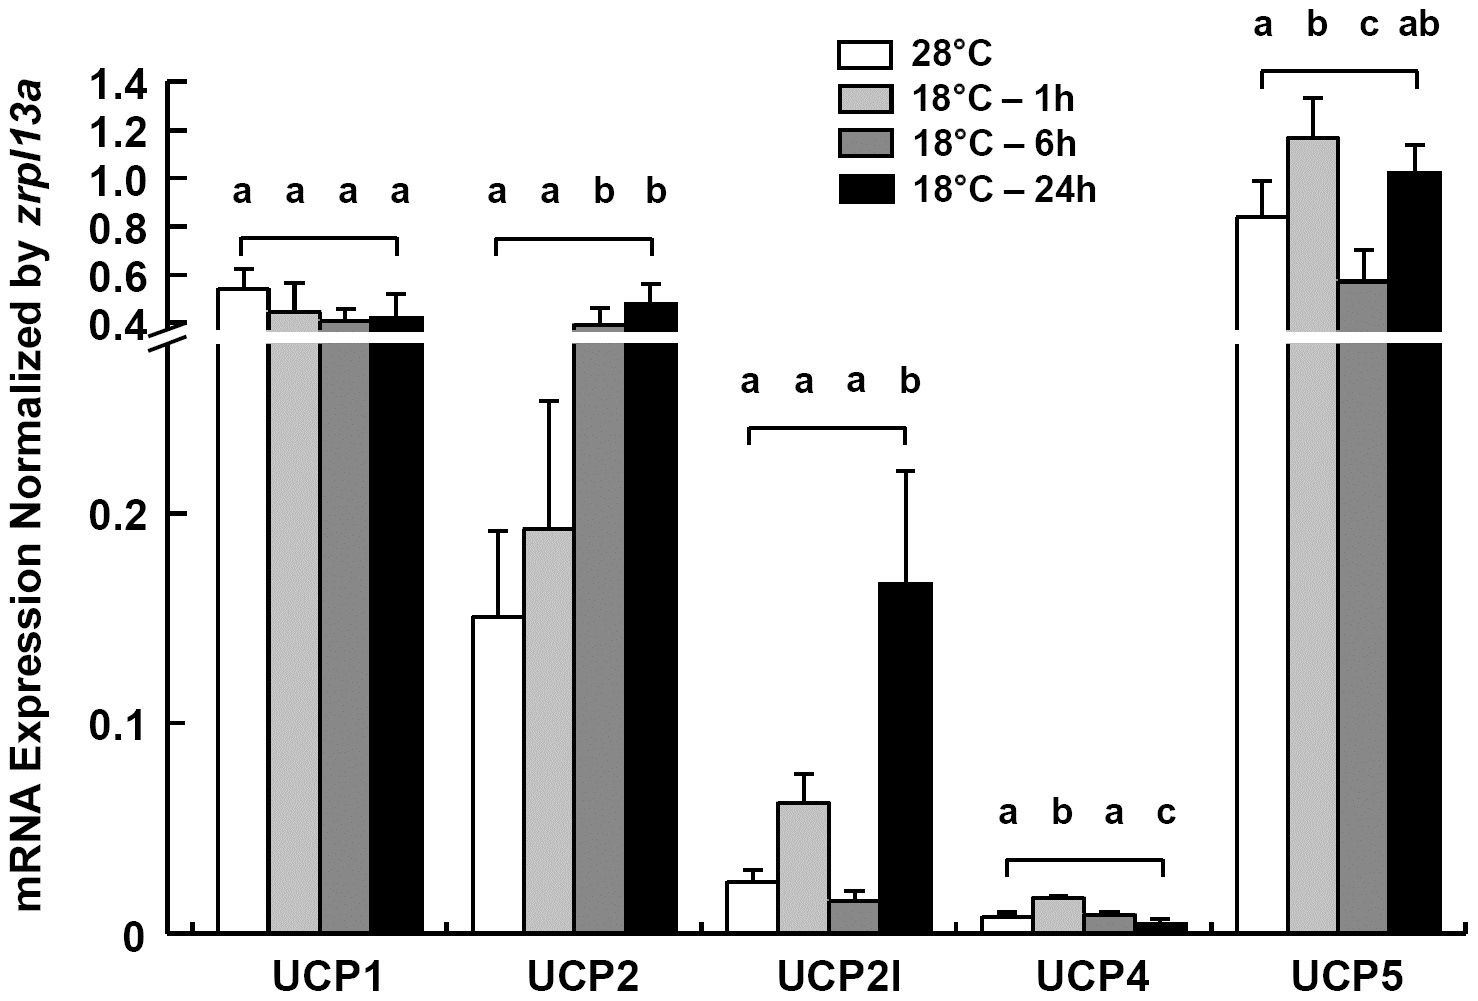
Fig. 8
UCP expressions in zebrafish brain.
qPCR analysis of 5 zucp isoforms in brains of zebrafish at 28°C and 1, 6 or 24 h after transfer to 18°C. rpl13a was used as the internal control. Data are presented as mean ± SD (N = 4). Different letters indicate significant differences between treatments (one-way ANOVA, Tukey′s pairwise comparison, p<0.05).
Figure Data
Acknowledgments
This image is the copyrighted work of the attributed author or publisher, and
ZFIN has permission only to display this image to its users.
Additional permissions should be obtained from the applicable author or publisher of the image.
Full text @ PLoS One