
|
Fig. 3
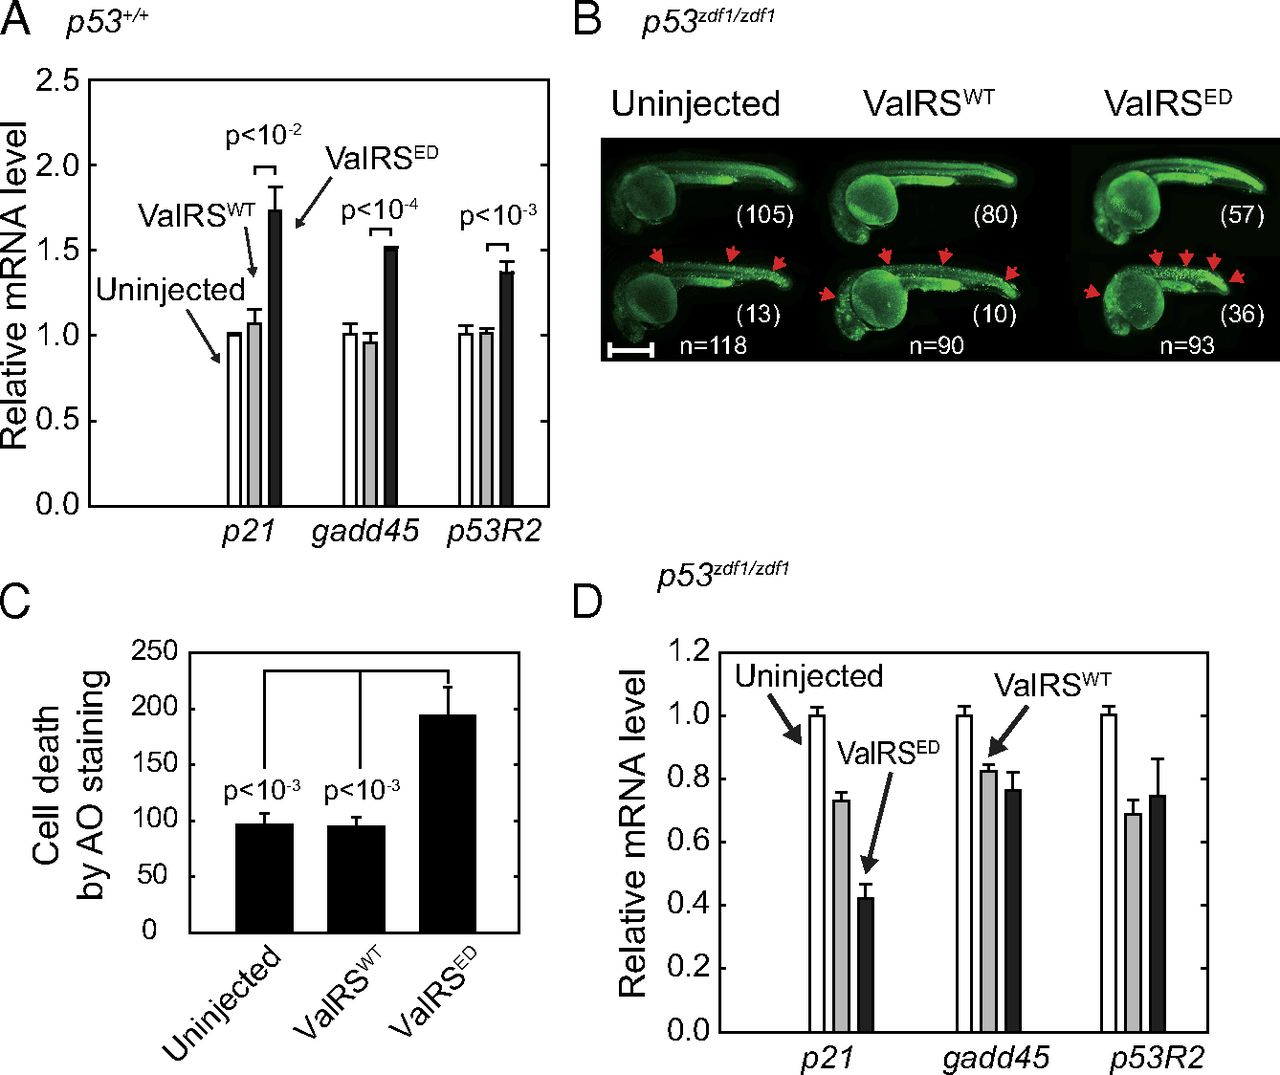
ED ValRS activates p53 in zebrafish. (A) RT-PCR results of p53 downstream markers p21, gadd45, and p53R2 in ValRSWT or ValRSED mRNA-injected zebrafish. The bar graphs show the mean values ± SEM after normalization to the β-actin level. (B) Uninjected (n = 118), ValRSWT mRNA-injected (n = 90), or ValRSED mRNA-injected (n = 93) p53zdf1/zdf1 zebrafish were stained with AO at 1 dpf. The red arrows show points of cell death. Zebrafish are aligned based on cell death severity. (Scale bar, 500 µm.) (C) Quantification of AO staining. Bars represent mean ± SEM. (D) RT-PCR results of p53 downstream markers p21, gadd45, and p53R2 in p53zdf1/zdf1 zebrafish injected with either ValRSWT or ValRSED mRNA. The bar graphs show the mean values ± SEM after normalization to the β-actin level.