
|
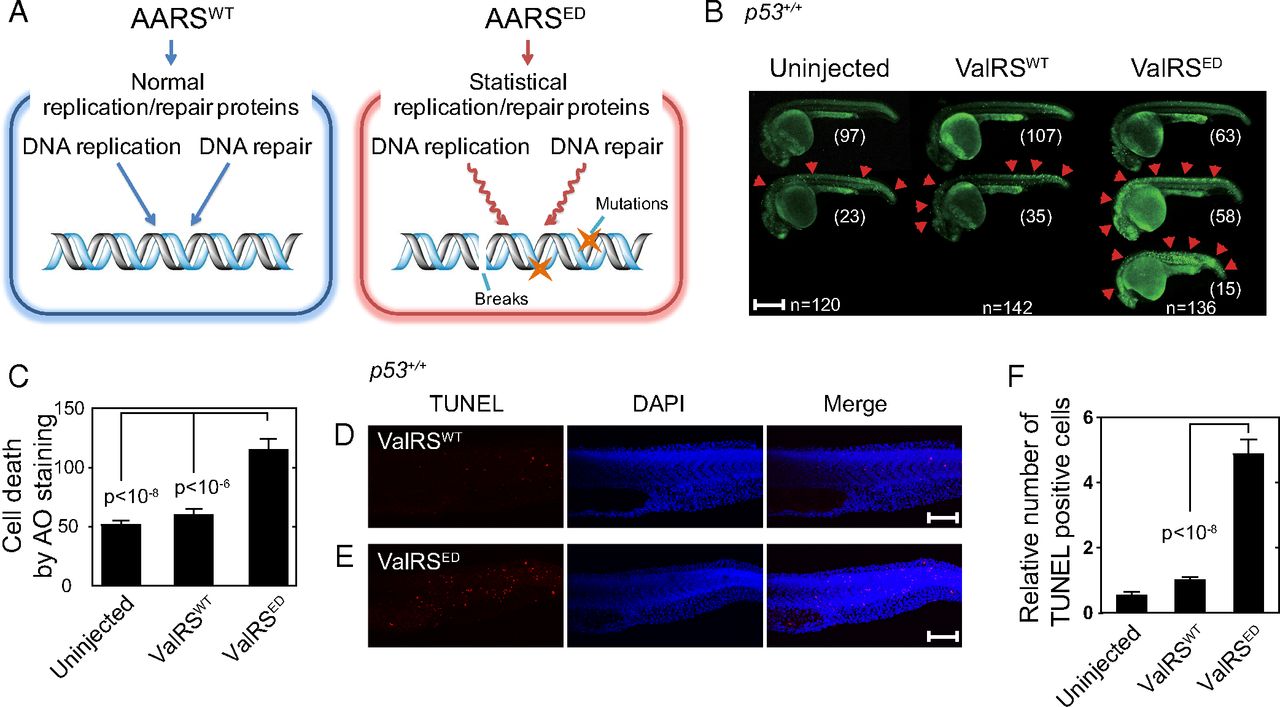
Fig. 1
ED ValRS causes cell death and DNA damage in zebrafish. (A) The ED tRNA synthetase is proposed to generate statistical replication and repair proteins that lead to increased DNA breaks. (B) AO staining at 1 dpf of zebrafish uninjected (n = 120), or injected with either ValRSWT mRNA (n = 142) or ValRSED mRNA (n = 136). The red arrows show points of cell death. Zebrafish are aligned vertically based on cell death severity and morphology; normal (Top), increased cell death (Middle), and increased cell death with abnormal morphology (Bottom). (Scale bar, 500 µm.) (C) Quantification of AO staining to determine average number of cell deaths per fish. Bars represent mean ± SEM. Images of TUNEL staining on fish injected with either (D) ValRSWT or (E) ValRSED mRNA. TUNEL staining, DAPI staining, and TUNEL merged with DAPI, are shown. (Scale bars, 100 µm.) (F) Quantification of the average number of TUNEL+ cells per fish (periderm or basal epidermal cells on the trunk). Independent areas [from the trunk region starting at the rostral start point of the yolk extension (the distal end of yolk) and extending through the end of the caudal fin] were selected from individual animals that had been injected with mRNA and were used for the quantification. Quantifications (Uninjected n = 13, ValRSWT n = 16, ValRSED n = 23) are shown in the graph. Bars represent mean ± SEM.