
|
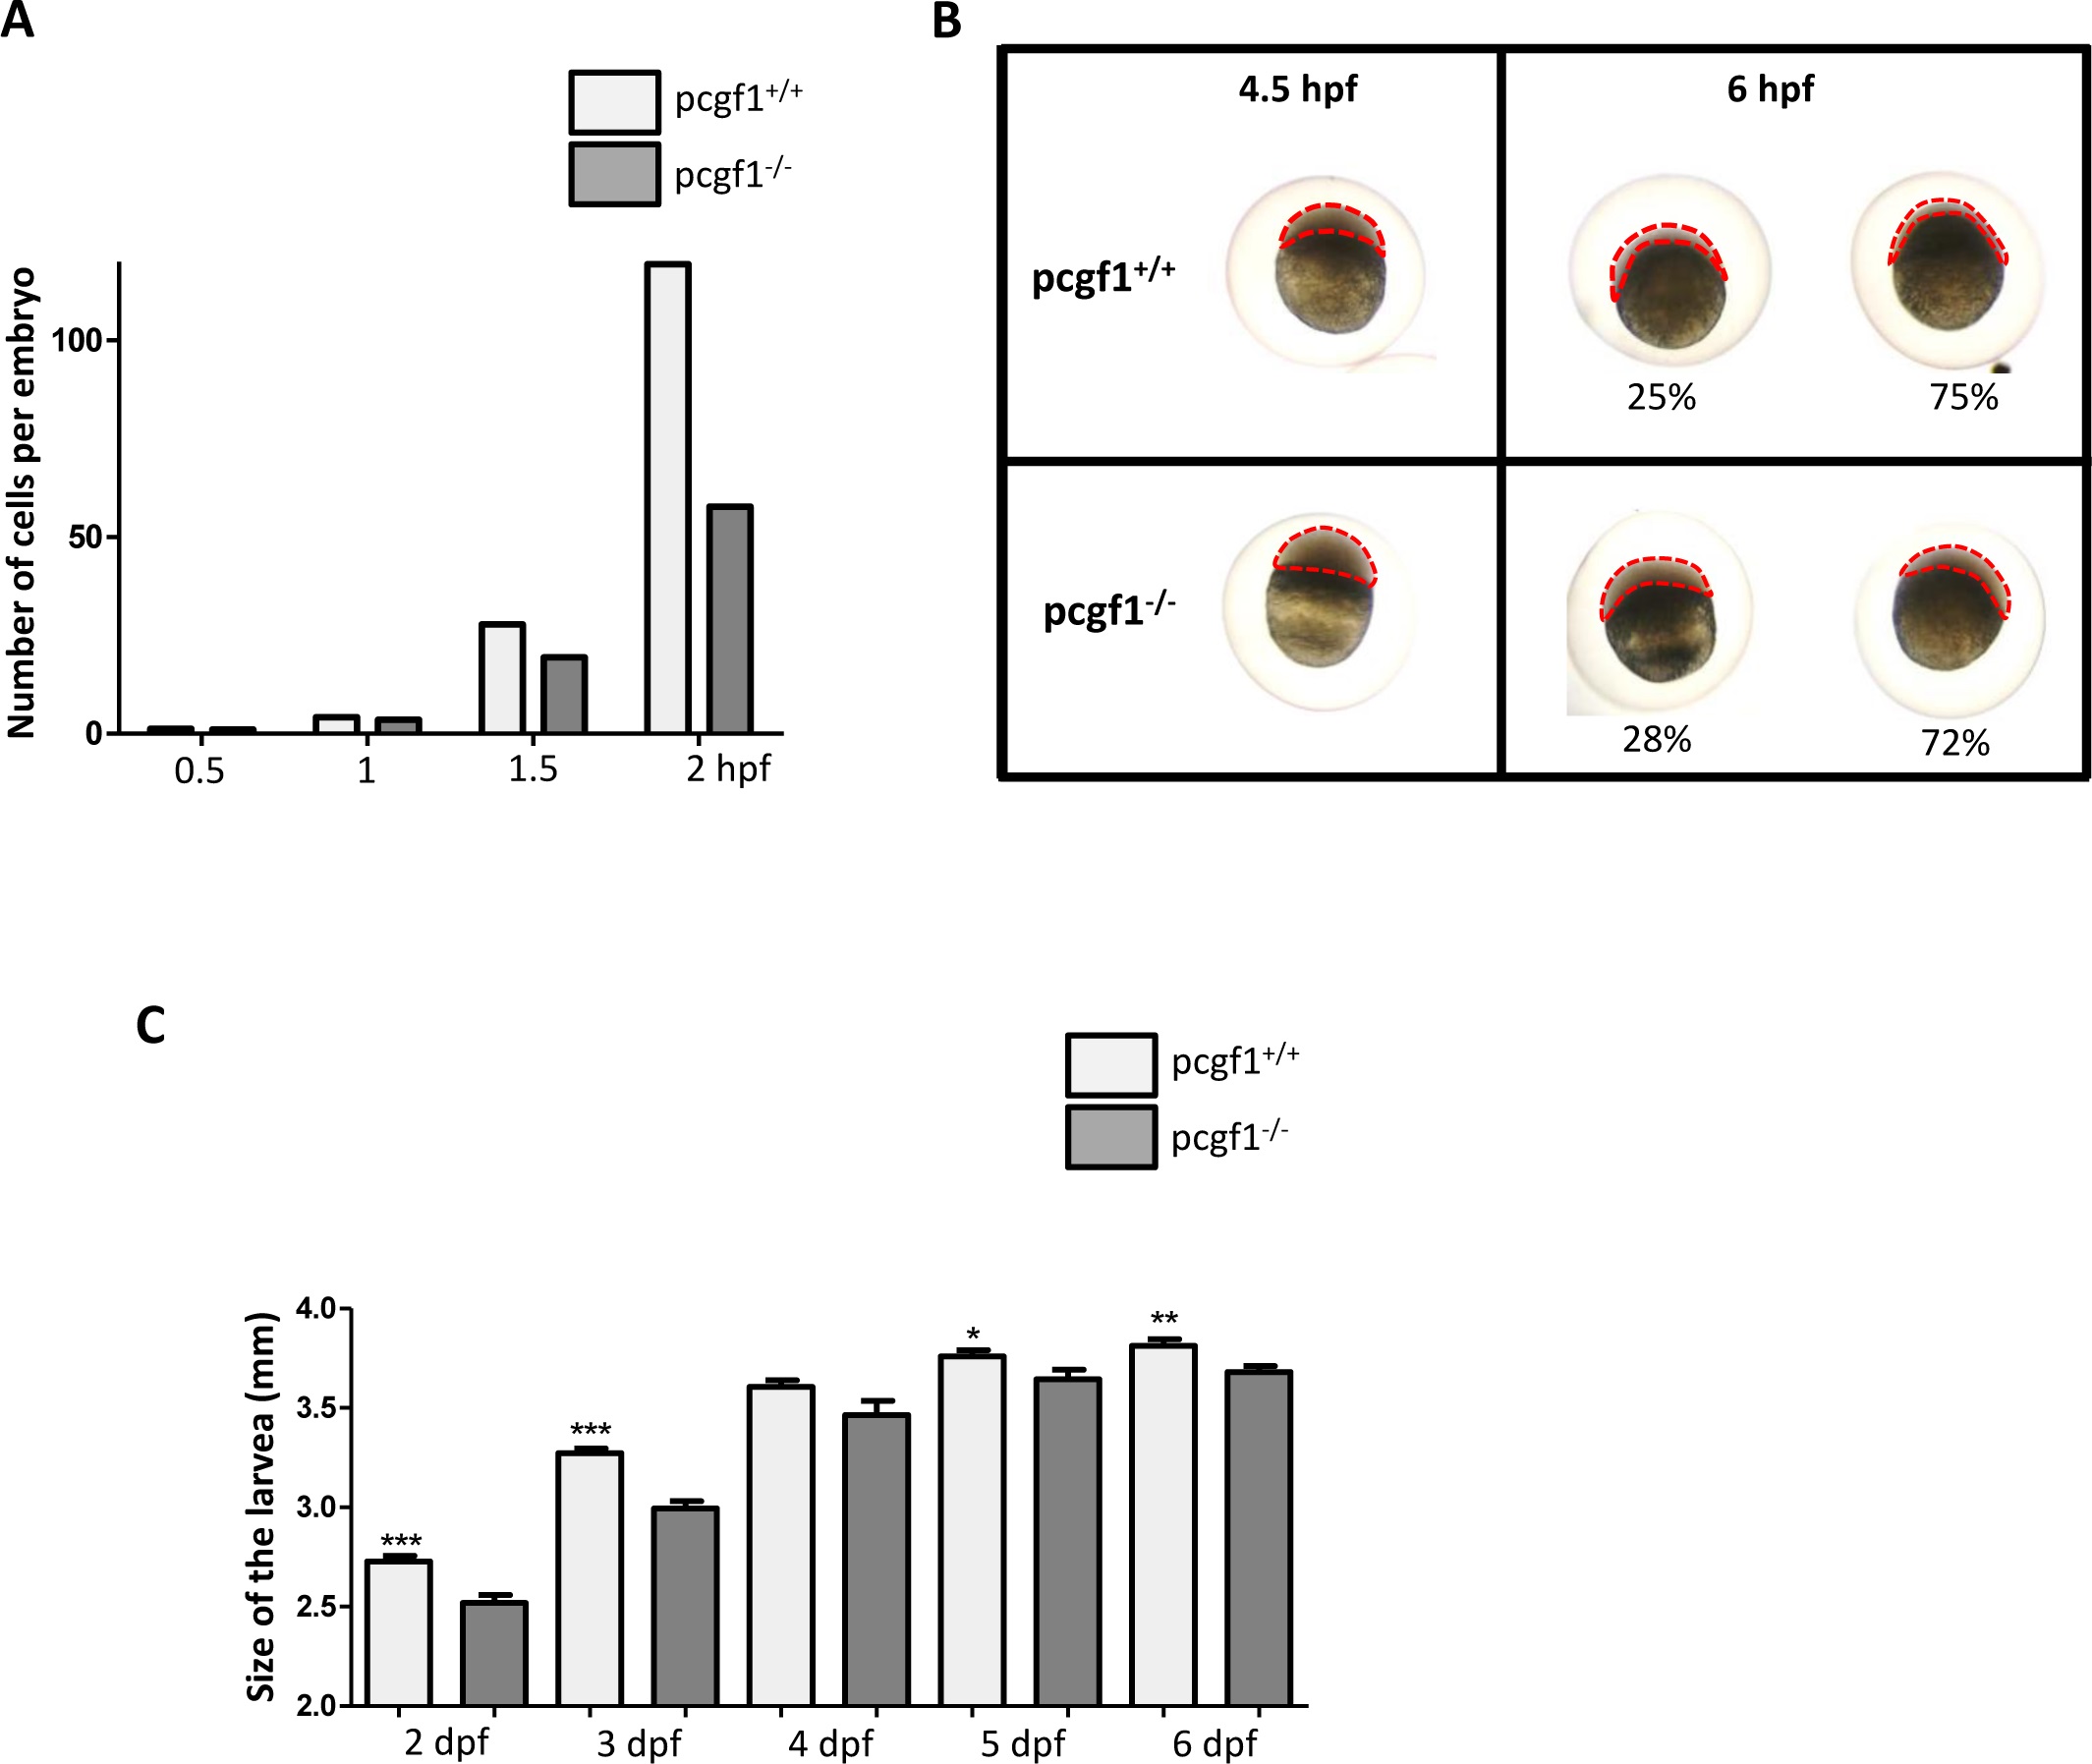
Fig. 6
Growth of pcgf1-/- mutants at early developmental stages.
(A) Comparison of pcgf1+/+ and pcgf1-/- embryo development during the cleavage period. Embryos from wild-type and mutant lines were fixed at 0.5, 1, 1.5 and 2 hpf, then 1-, 2-, 4-, 8-, 16-, 32-, 64-, 128- and 256-cell embryos were then counted, and results are expressed as the number of cells per embryo; n > 100 embryos per time point for each genotype. (B) Comparison of pcgf1+/+ and pcgf1-/- embryo development at blastula and gastrula periods. Embryos were fixed at 4.5 and 6 hpf and representative embryos are shown. At 6 hpf embryos can be classified into 2 classes and the proportion of embryos of each group is indicated; n > 100 embryos. (C) Comparison of the size from head to tail, of fixed pcgf1+/+ and pcgf1-/- larvae at 2, 3, 4, 5 and 6 dpf; Error bars indicate ± SD. Statistical significance was assessed by Student t-test analysis and significance expressed as the value of p (*, p < 0.1; **, p < 0.01, ***, p < 0.001). Measurements on embryos and larvae were done on 3 independent experiments using materials from different (3 to 6) layings.