
Image
|
Figure Caption
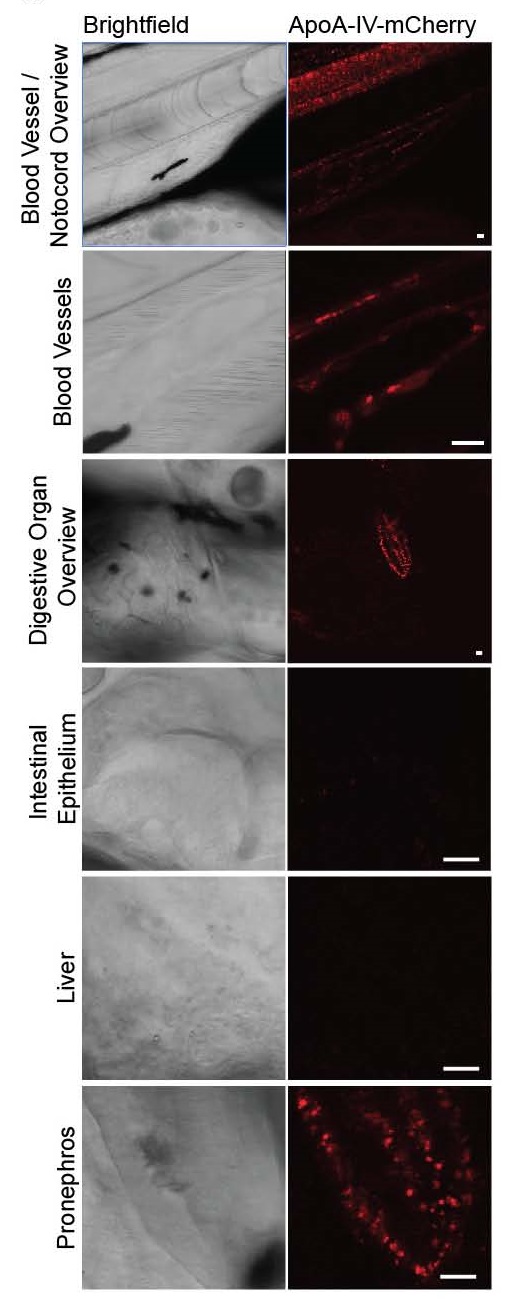
Fig. S9
Representative images of Tg(hsp70:apoA-IVb.1:mCherry) larvae ~18 hours post-heat shock. mCherry signal represents mCherry protein; mCherry signal in the digestive organ overview is visible in the pronephros. Larvae are 7 days post-fertilization, anesthetized in tricane and immobilized in 1.2% low melt agarose. Imaging was conducted with a 25X water immersion objective on a Leica SP5 confocal microscope. Scale bars represent 10 microns.
Figure Data
Acknowledgments
This image is the copyrighted work of the attributed author or publisher, and
ZFIN has permission only to display this image to its users.
Additional permissions should be obtained from the applicable author or publisher of the image.
Full text @ Dis. Model. Mech.