
|
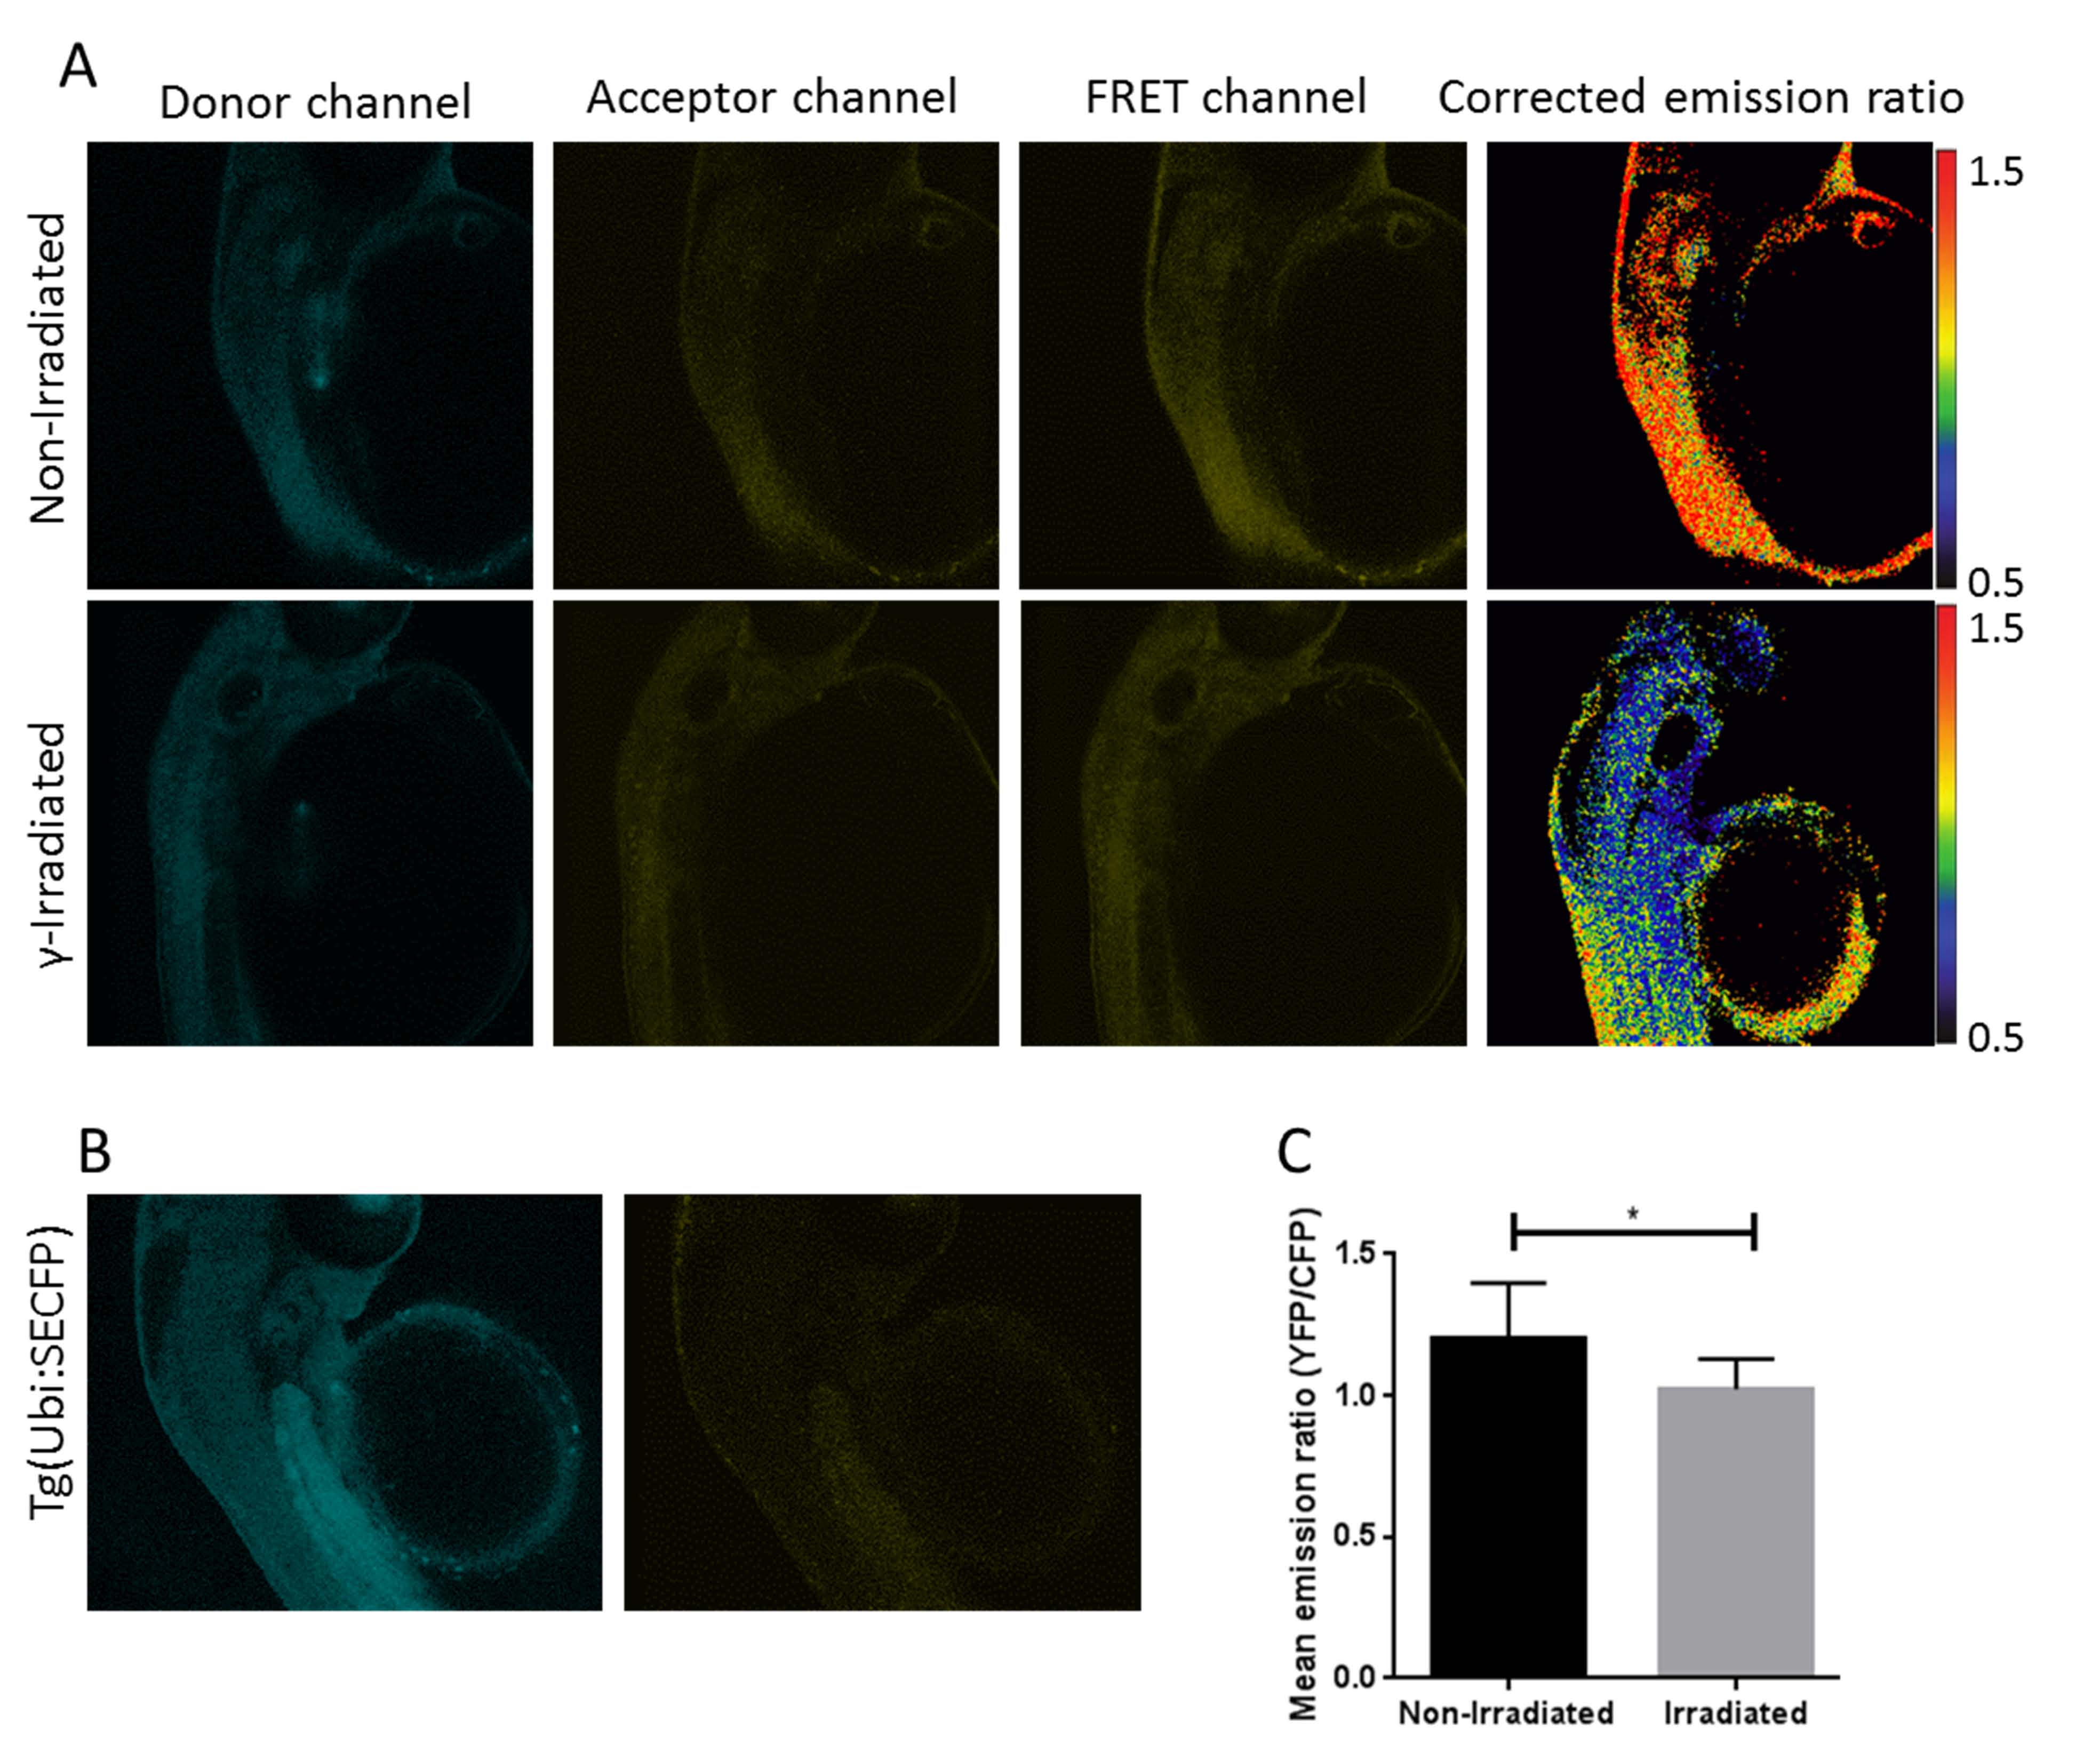
Fig. S3
A) Spectrally resolved fluorescence images of 48 hpf Tg(Ubi:Caspase3 biosensor) embryos: “Donor channel” corresponds to donor excitation & donor channel detection; “Acceptor channel” corresponds to acceptor excitation & acceptor channel detection; “FRET channel” corresponds to donor excitation & acceptor channel detection and “Corrected emission ratio” corresponds to the corrected mean acceptor/donor emission ratio calculated using FiJi following the protocol published by Kardash et al [27]. B) 48 hpf Tg(Ubi:SECFP) embryo (i.e. expressing only the donor fluorophore) showing cross-talk in acceptor channel. C) Graph showing a statistical significance of p>0.05 (*) between corrected mean acceptor/donor emission ratio of irradiated versus non-irradiated embryos. This corrected acceptor/donor emission ratio was averaged over all the pixels in each field of view and statistical analysis across multiple experiments was performed with n≥7 in each category using GraphPad Prism 6. Data showed a normal distribution so an unpaired t-test was used.