
|
Fig. 4
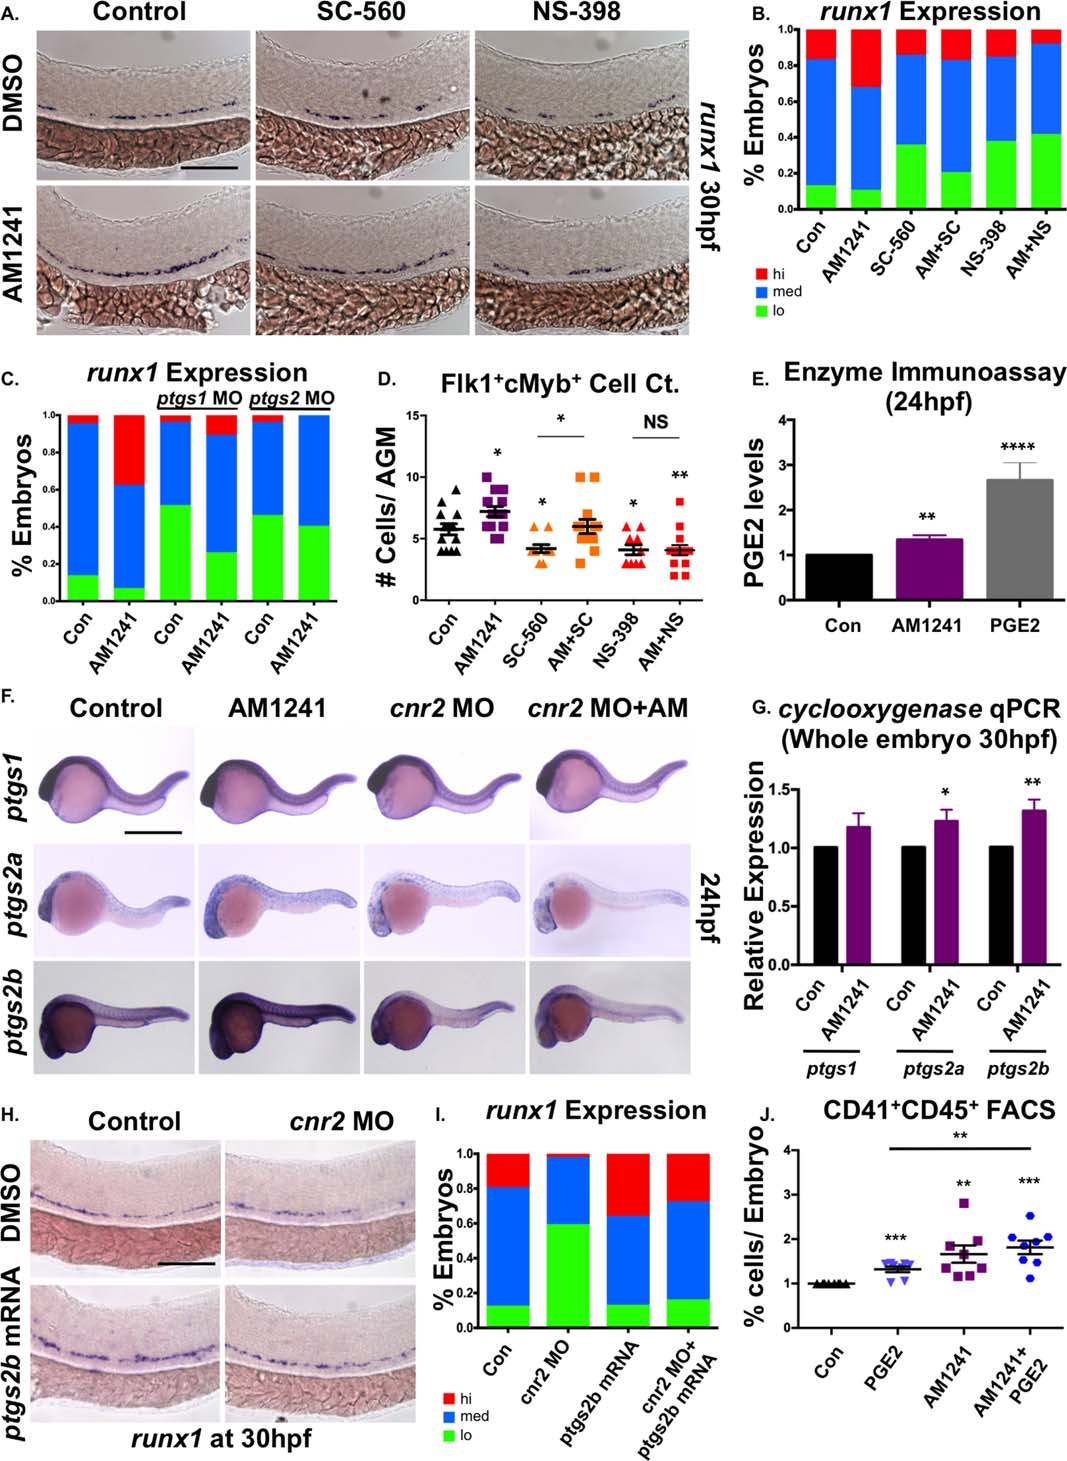
CNR2-signaling increases PGE2 production via ptgs2 induction.
(A): Treatment with selective cyclooxygenase (Ptgs)-1 (SC-560, 10 µM) and Ptgs2 (NS-398, 10 µM) inhibitors (12–30 hpf) decreased runx1 expression in the AGM; the effect of SC-560 on runx1, but not that of NS-398, was ameliorated by addition of AM1241 (n ≥ 90 per condition).
(B): Qualitative phenotypic distribution of embryos from panel (A), scored with low, medium, or high runx1 expression in the AGM.
(C): Qualitative phenotypic distribution of embryos injected with ptgs1 or ptgs2a/ptgs2b MOs in the presence or absence of AM1241-treatment, scored with low, medium, or high runx1 expression; the effect of MO-mediated reduction in Ptgs1, but not that of Ptgs2, on runx1 was restored to wild type levels by exposure to AM1241 (n ≥ 25 per condition).
(D): Quantification of the independent and combined effects of selective Ptgs inhibitors and AM1241 by absolute counts of Flk1:dsRed+;cMyb:GFP+ hematopoietic stem cells in embryos, treated as in panel (A), indicated AM1241 acts via Ptgs2 to impact HSCs (DMSO: 5.8 ± 0.5, AM1241: 7.2 ± 0.4, SC-560, 4.1 ± 0.4, AM1241+SC-560: 6.0 ± 0.6, NS-398: 05.8 ± 0.5, AM1241+NS-398: 04.1 ± 0.4; *, p ≤ .05, two-tailed t test, n ≥ 10 per condition).
(E): Embryos exposed to AM1241 (12–24 hpf) exhibited augmented PGE2 production: relative concentration of PGE2 was measured in AM1241- and PGE2-treated (positive control) embryos via a biochemical assay for PGE2-metabolites (PGE2, 2.66-fold; AM1241, 1.35-fold; **, p < .01, two-tailed t test, n = 7).
(F): Whole-mount in situ hybridization for ptgs1, ptgs2a, and ptgs2b at 24 hpf showed each was upregulated in response to AM1241 exposure (12–24 hpf); MO knockdown of cnr2 decreased the expression level of ptgs2a and ptgs2b, but not of that of ptgs1, and blocked the transcriptional response to AM1241-treatment (n e 25 per condition).
(G): qPCR analysis at 30 hpf confirmed ptgs2a and ptgs2b were significantly upregulated over baseline following AM1241 exposure, whereas ptgs1 expression was not (ptgs1: 1.17-fold, NS; ptgs2a: 1.22-fold, *, p < .05; ptgs2b: 1.31-fold, **, p d .01, two-tailed t test, n = 25 pooled embryos per condition × >10 replicates).
(H): Overexpression of ptgs2b normalized runx1 expression in the AGM of cnr2 morphants (n e 40 per condition).
(I): Qualitative phenotypic distribution of embryos from panel (I), scored with low, medium, or high runx1 expression in the AGM.
(J): The effect of combinatorial AM1241- and dmPGE2-treatment (5 µM each) was quantified by FACS using cd41:gfp;cd45:dsRed embryos (dmPGE2: 1.32-fold, AM1241: 1.66-fold, AM1241+dmPGE2: 1.82-fold; **, p d .01; ***, p d .001, two-tailed t test, n = 8 per condition). Scale bars (A) = 100 µm, (F) = 800 µm, (H) = 125 µm. Abbreviations: AGM, aorta-gonad-mesonephros; DMSO, Dimethyl Sulfoxide; FACS, fluorescence-activated cell sorting; MO, morpholino; PGE2, prostaglandin E2; ptgs, prostaglandin endoperoxide synthase; qPCR, quantitative polymerase chain reaction.