
|
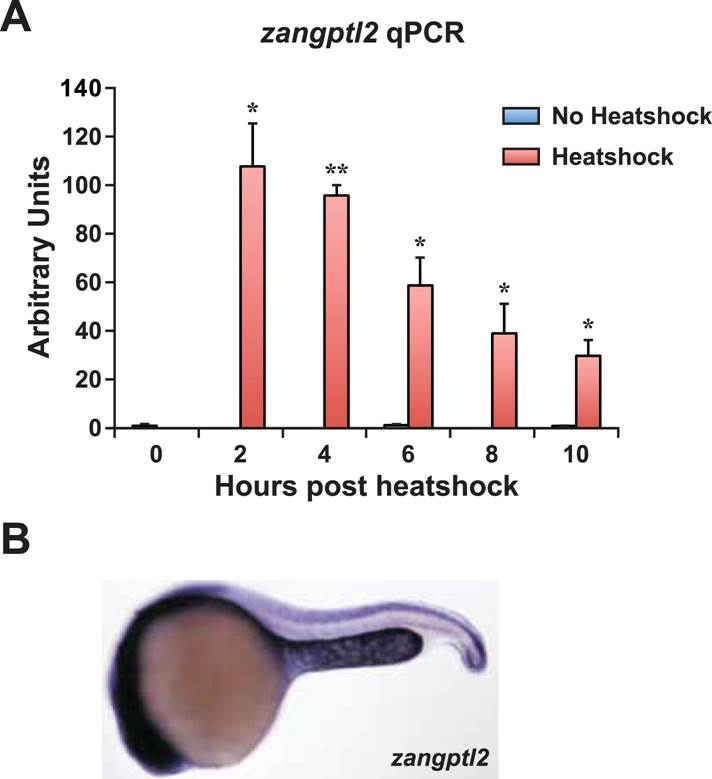
Fig. 1, S1 Zangptl2 overexpression in Tg(hsp70:zangptl2) embryos and endogenous zangptl2 expression.
(A) qPCR analysis of zangptl2 mRNA levels in Tg(hsp70:zangptl2) embryos that have been heatshocked for 1 hr and collected at the indicated times post-heatshock. Heatshocked embryos (red bars) overexpressed zangptl2 mRNA at least 100-fold in excess compared to non-heatshocked siblings (blue bars). Error bars denote S.E.M., *p < 0.05, **p < 0.01 compared to 0 hr, one way ANOVA. (B) WISH of endogenous zangptl2 at 23hpf (the highest of all timepoints observed) is mostly restricted in the yolk sac extension, spinal cord, and head region.