
|
Fig. S3
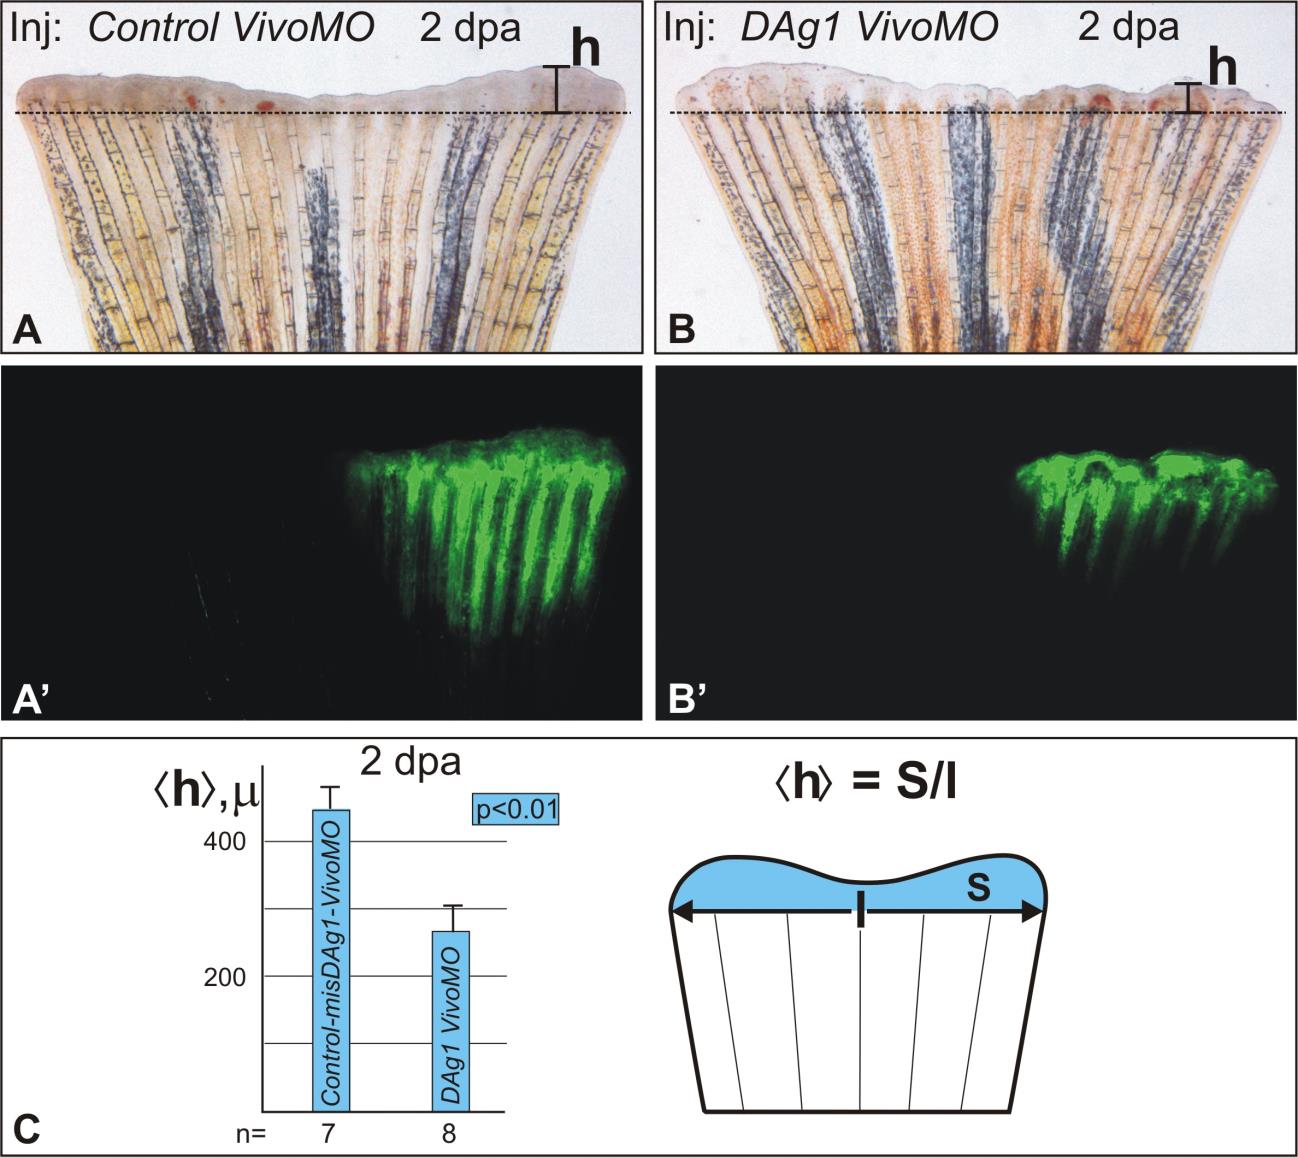
Comparison of effects of DAg1 and control mismatch DAg1MO.
A and A′. Caudal fin injected by the control-misDAg1 Vivo-MO mixed with FLD in the right side. No retardation of regeneration is seen on the injected side. Dashed line indicates the level of amputation.
B and B′. Caudal fin injected by the DAg1 Vivo-morpholino mixed with FLD in the right side. Note retardation of regeneration of the injected side.
C. Quantification of the mean height of the regenerating part of caudal fins injected by controlmisDAg1 Vivo-MO or DAg1 Vivo MO at 2 dpa. Numbers of the injected fins are indicated by n. The schema in the middle demonstrates how mean height