
|
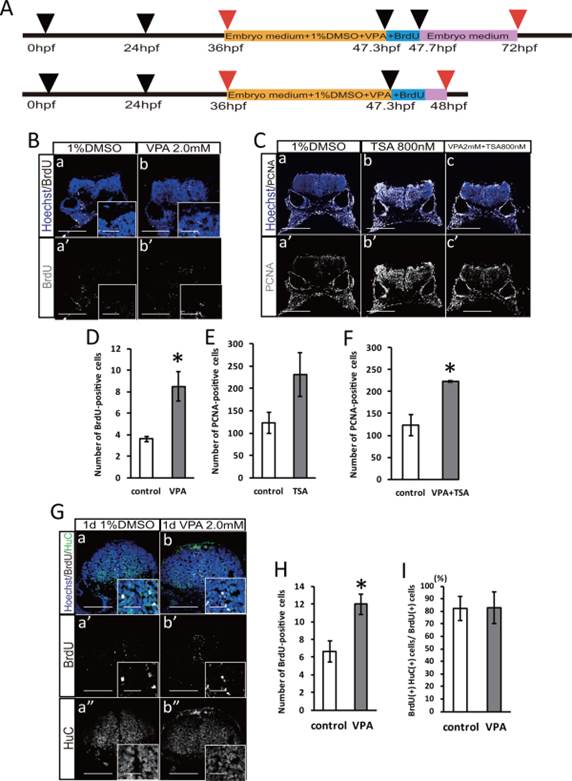
Fig. 3
VPA administration does not relate to the promotion of neuronal differentiation. A: Timeline of drug treatment and BrdU labeling. B: Immunostaining with BrdU in the embryo zebrafish hindbrain with or without 2.0 mM VPA treatment. Scale bar = 100 µm, inset of 20 µm. C: Immunostaining with PCNA in the embryo zebrafish hindbrain with or without 2.0 mM VPA and 800 nM TSA treatment. Scale bar = 100 µm. D: Number of BrdU-positive cells with or without 2.0 mM VPA treatment (control: n = 5; VPA: n = 6). E: Number of PCNA-positive cells with or without 800 nM TSA treatment (P=0.12; control: n = 3; TSA: n = 3). F: Number of PCNA-positive cells with or without 2.0 mM VPA and 800 nM TSA treatment (control: n = 3; VPA+TSA: n = 3). G: Immunostaining with BrdU and HuC in the embryo zebrafish hindbrain with or without 2.0 mM VPA treatment. Scale bar = 100 µm, inset of 20 µm. H: The number of BrdU-positive cells (control: n = 3; VPA: n = 3). I: The percentage of BrdU and HuC double-positive cells in BrdU-positive cells (P=0.97; control: n = 3; VPA: n = 3). *P < 0.05.