
|
Fig. 5
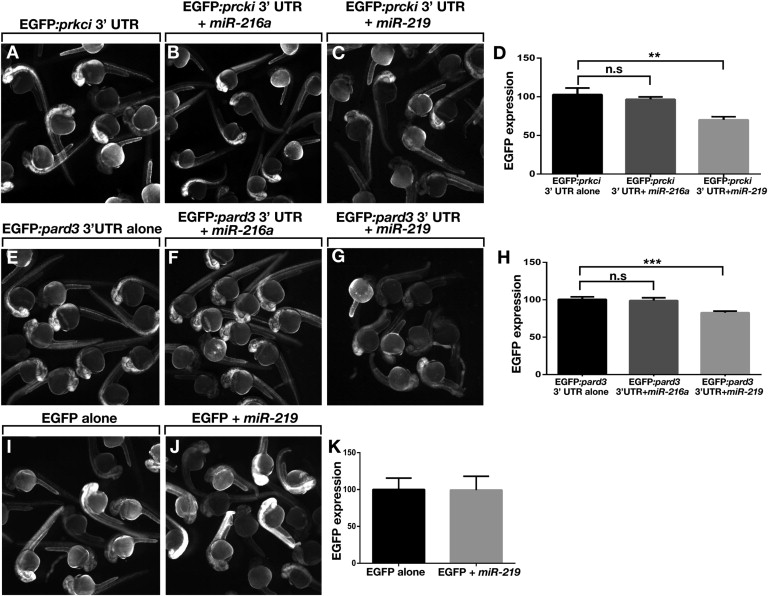
mir-219 Regulates Reporter Gene Expression In Vivo via pard3 and prkci 32 UTR Sequences
(A–C) Fluorescence images of living embryos injected with EGFP:prkci 32 UTR mRNA alone, miR-216a control, or miR-219.
(D) Graph showing EGFP fluorescence intensity values. Units represent pixel intensity and are reported as percent of control values (n = 20 embryos, with three replicates). Brackets indicate pairwise comparisons. p = 0.0014, unpaired t test.
(E–G) Images of living embryos injected with EGFP:pard3 32 UTR mRNA alone, miR-216a control, or miR-219.
(H) EGFP fluorescence intensity values shown as in (D) (n = 20 embryos, with three replicates). p = 0.0001 unpaired t test.
(I and J) Images of embryos injected with EGFP mRNA alone or with miR-219.
(K) EGFP fluorescence intensity values shown as in D (n = 20 embryos, with two replicates). p = 0.8728, unpaired t test.
Error bars represent ± SEM.
Reprinted from Developmental Cell, 27(4), Hudish, L.I., Blasky, A.J., and Appel, B., miR-219 Regulates Neural Precursor Differentiation by Direct Inhibition of Apical Par Polarity Proteins, 387-398, Copyright (2013) with permission from Elsevier. Full text @ Dev. Cell