
Fig. 4
|
Fig. 4
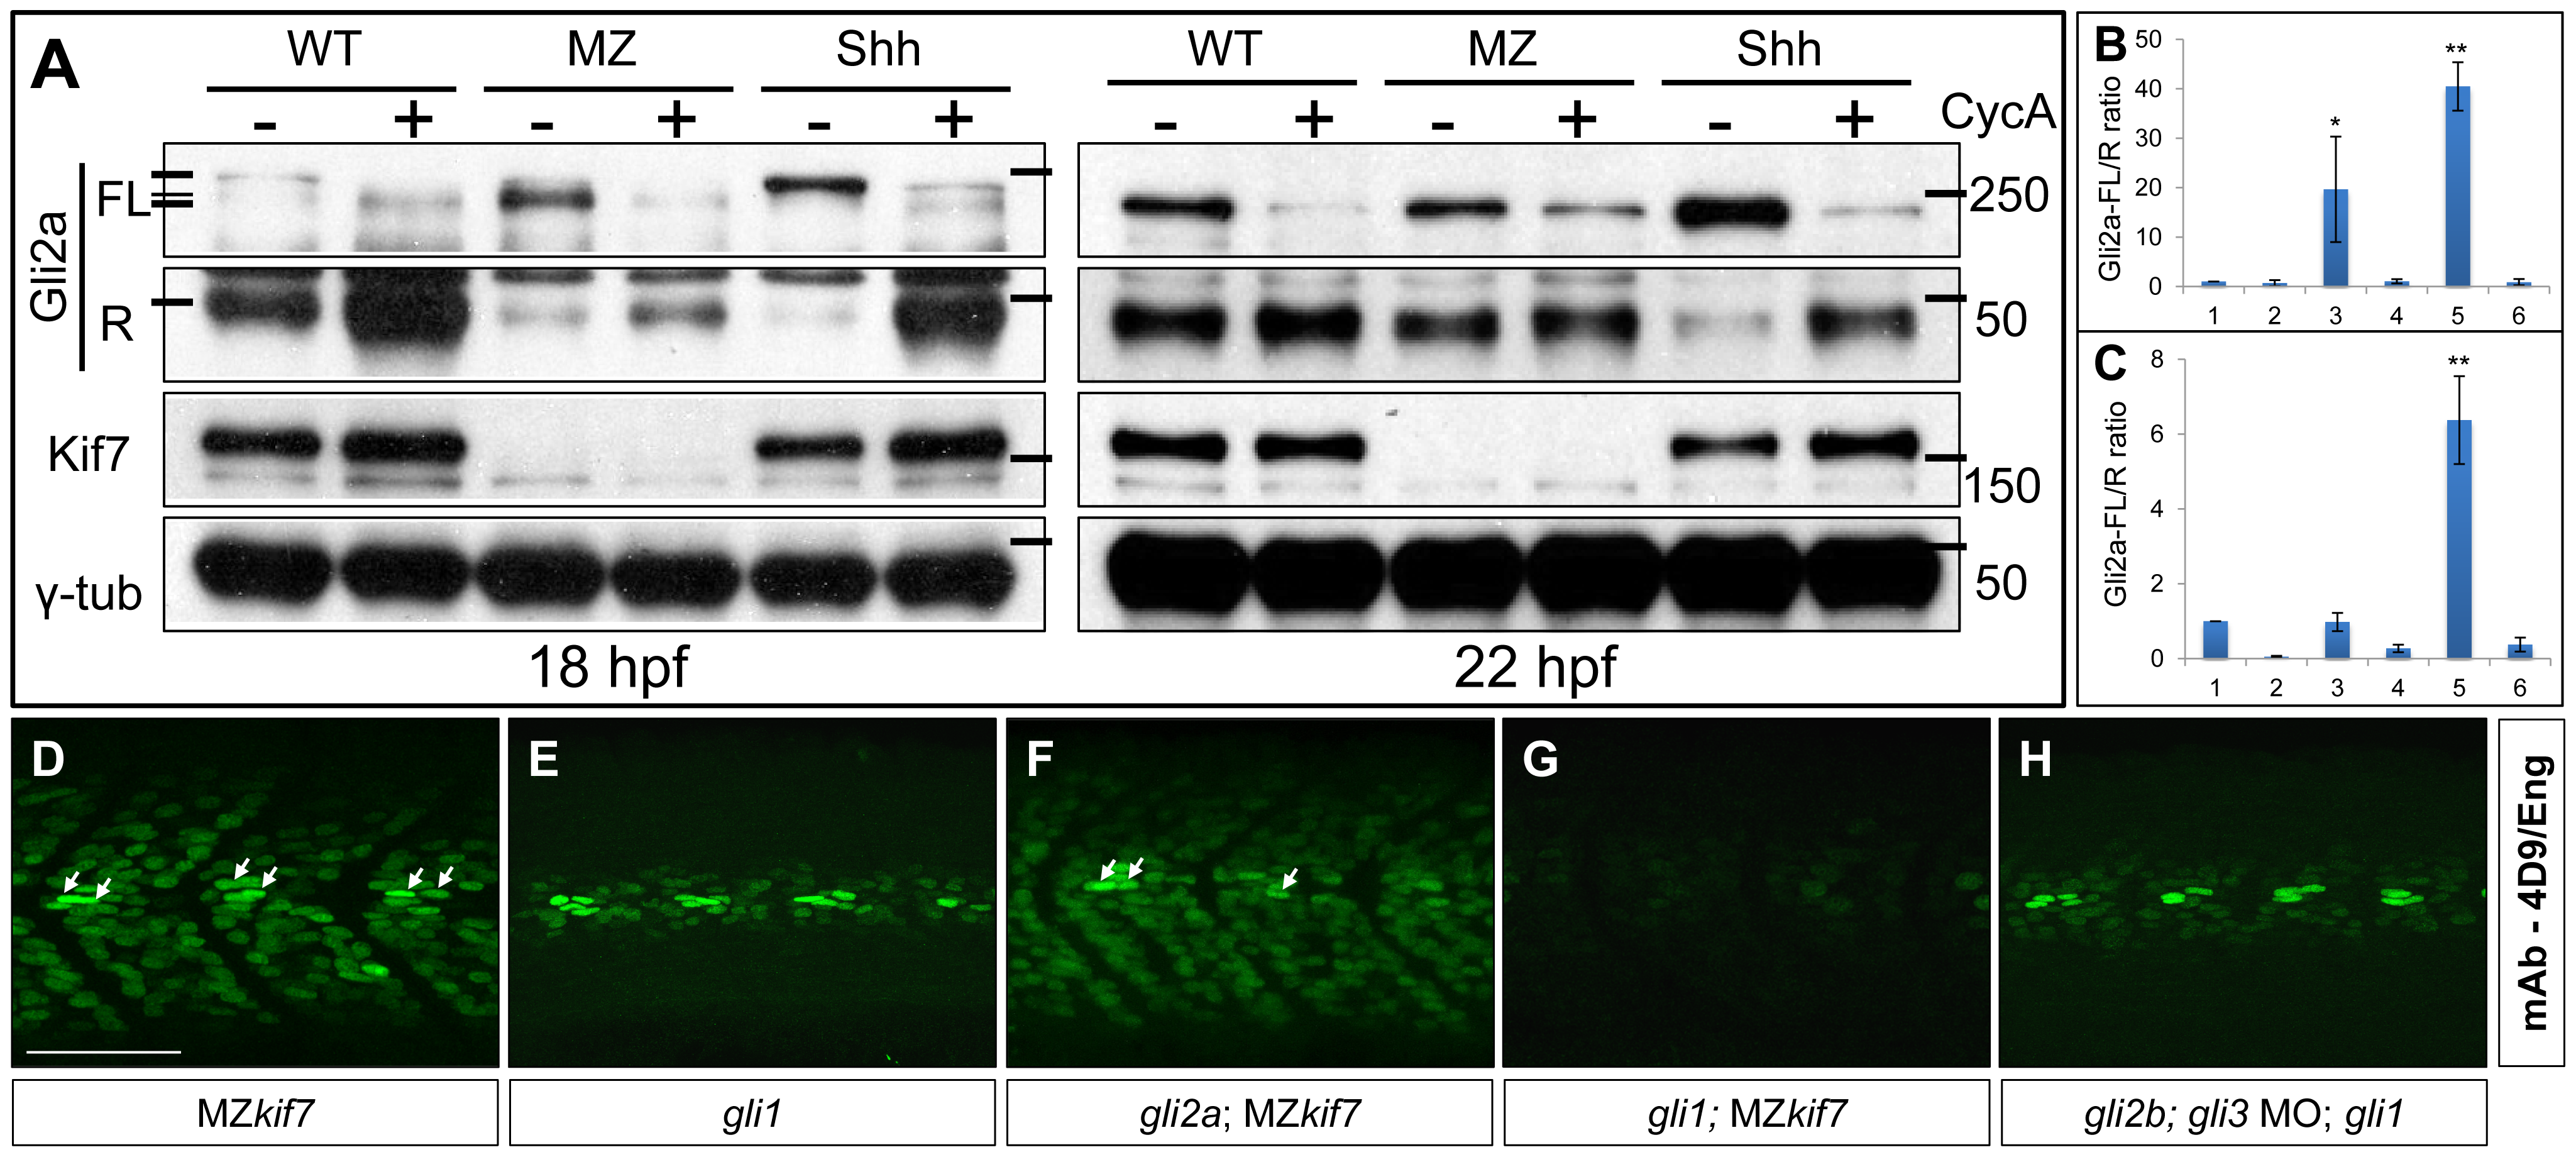
Regulation of Gli processing and activity by Kif7.
(A) Western blot analysis showing Gli2a processing in wild-type (WT), MZkif7 (MZ) and Shh mRNA injected (Shh) embryos at 18 hpf (left panel) and at 22 hpf (right panel) compared to the same set treated with cyclopamine (CycA). Full-length (FL) and repressor (R) forms of Gli2a are indicated. The lower panels shows the same blot re-probed with Kif7 and γ-tubulin (loading control) antibodies (B,C) Quantification of the Gli2a FL:R ratio normalized to WT at 18 hpf (B) and 22 hpf (C). Bar graphs numbered 1–6 represent lanes on the blots in (A) from left to right. Error bars represent standard deviation obtained from three independent Western blots including those shown in (A). Single asterisk: P<0.02; double asterisk: P<0.001. (D–H) Parasagittal optical sections of 30 hpf embryos of different genotypes showing expression of Eng-expressing muscle cells as revealed by mAb4D9 (green). The MZkif7 phenotype (D) is largely unaffected by removal of Gli2a (F), other than the loss of the some MP cells (arrows); by contrast, Eng expression is nearly eliminated in the MZkif7;gli1 double mutant embryo (G), despite Gli1 being dispensable for Eng expression in the presence of Kif7 function (E). Knockdown of gli2b and gli3 activity using morpholinos in gli1 mutants (H) has no effect on Eng expression in the myotome. Scale bar: 50 μm.