
Fig. 6
|
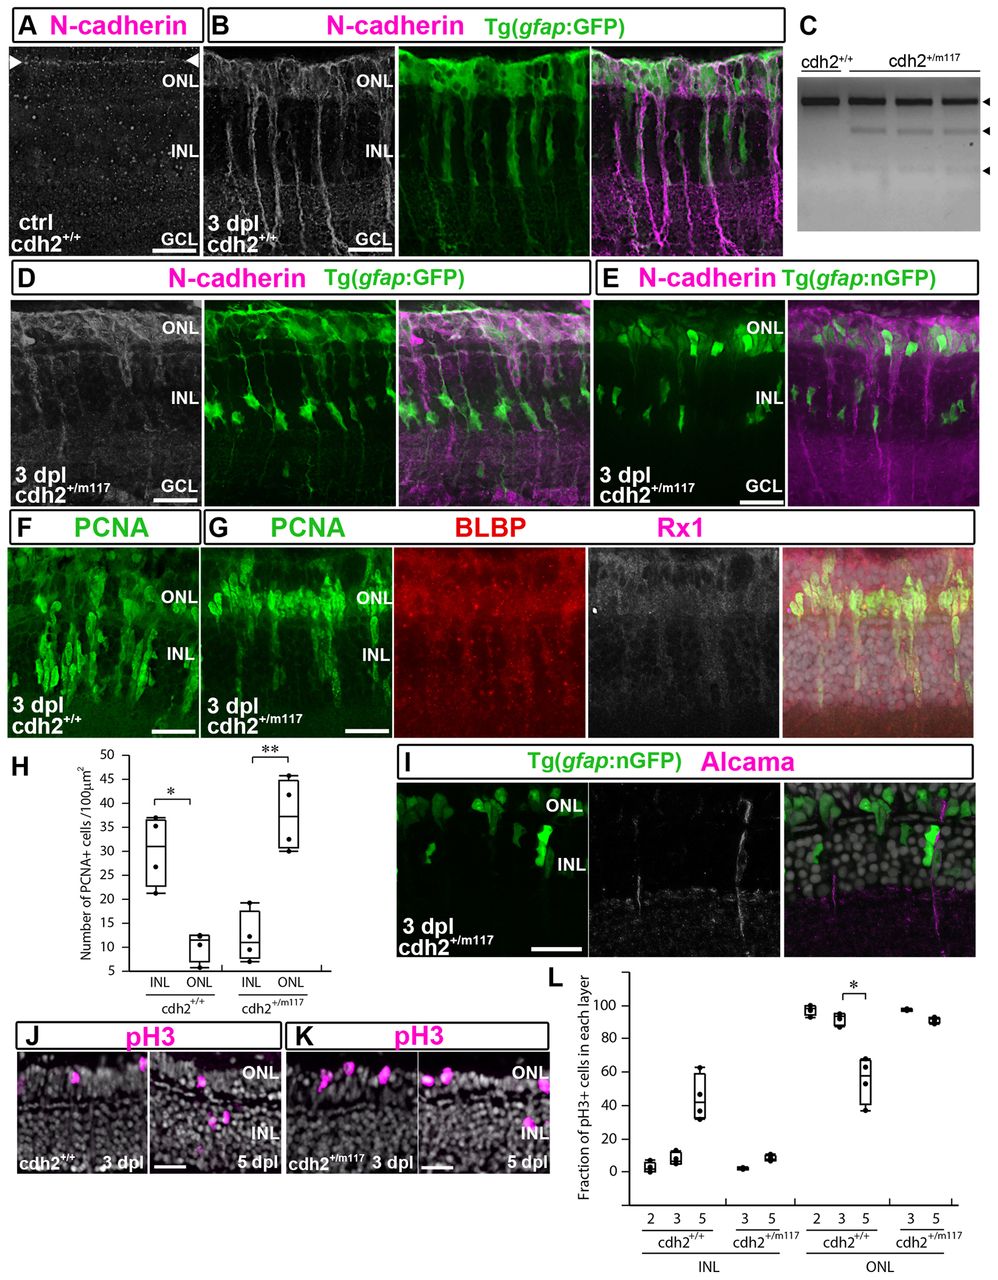
Fig. 6
Reduction of N-cadherin function interferes with formation of neurogenic clusters after light lesions. (A) N-cadherin (white/magenta) at OLM (between arrowheads) in unlesioned (ctrl) retina. (B) At 3 dpl, N-cadherin (white/magenta) in Müller glia and progenitors (green). (C) RT-PCR products of cdh2 digested with BsmBI. (D,E) N-cadherin (white/magenta) in the ONL at 3 dpl in cdh2+/m117; mi2002 (D) and cdh2+/m117; mi2004 (E). (F) Neurogenic clusters (PCNA+; green) in sib retinas at 3 dpl. (G) PCNA+ (green)/BLBP+ (red)/Rx1+ (white/magenta) progenitors in cdh2+/m117 hets at 3 dpl. (H) Counts of PCNA+ progenitors in the INL and ONL at 3 dpl. *P<0.005, **P<0.0005. (I) Nuclei of nGFP+/Alcama+ (white/magenta) Müller glia in the INL and nGFP+/Alcama- progenitors in the ONL at 3 dpl in cdh2+/m117; mi2004. (J) pH3+ (magenta) nuclei at 3 and 5 dpl in sibs. (K) pH3+ (magenta) nuclei at 3 and 5 dpl in cdh2+/m117 hets. (L) Fraction of pH3+ cells in INL and ONL after lesion. *P<0.0001. Box plots: median, 25th and 75th percentiles; whiskers show maximum and minimum data points. Scale bars: 20 μm.