
|
Fig. 3
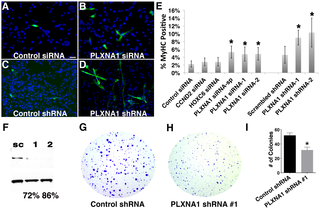
Figure 3. Knockdown of PLXNA1 induced differentiation and impaired anchorage-independent growth of human ERMS cells.
RD cells stained with myosin heavy chain (MF20) and DAPI following culture under differentiation conditions for 72 hrs. (A) Control siRNA. (B) PLXNA1 smart-pool siRNA. (C) Control scrambled shRNA. (D) PLXNA1 shRNA-1. DAPI, blue; MF20-positive cell, green. (E) Quantification of MF-20 immunofluorescence in siRNA and shRNA-knockdown RD cells. Asterisk indicates significant differences between gene knock- down and control cells (p<0.05). Error bars denote standard deviation. (F) Western analysis of PLXNA1 shRNA stable knockdown; sc, scrambled control shRNA; 1, PLXNA1 shRNA-1; 2, PLXNA1 shRNA-2. A soft agar colony formation assay to assess PLXNA1 knockdown effects on anchorage-independent growth (G–I). (G) Control scrambled shRNA. (H) PLXNA1 shRNA. (I) Quantification of colony formation assay results. Error bar indicates standard deviation from triplicate experiments.