
|
Fig. S1
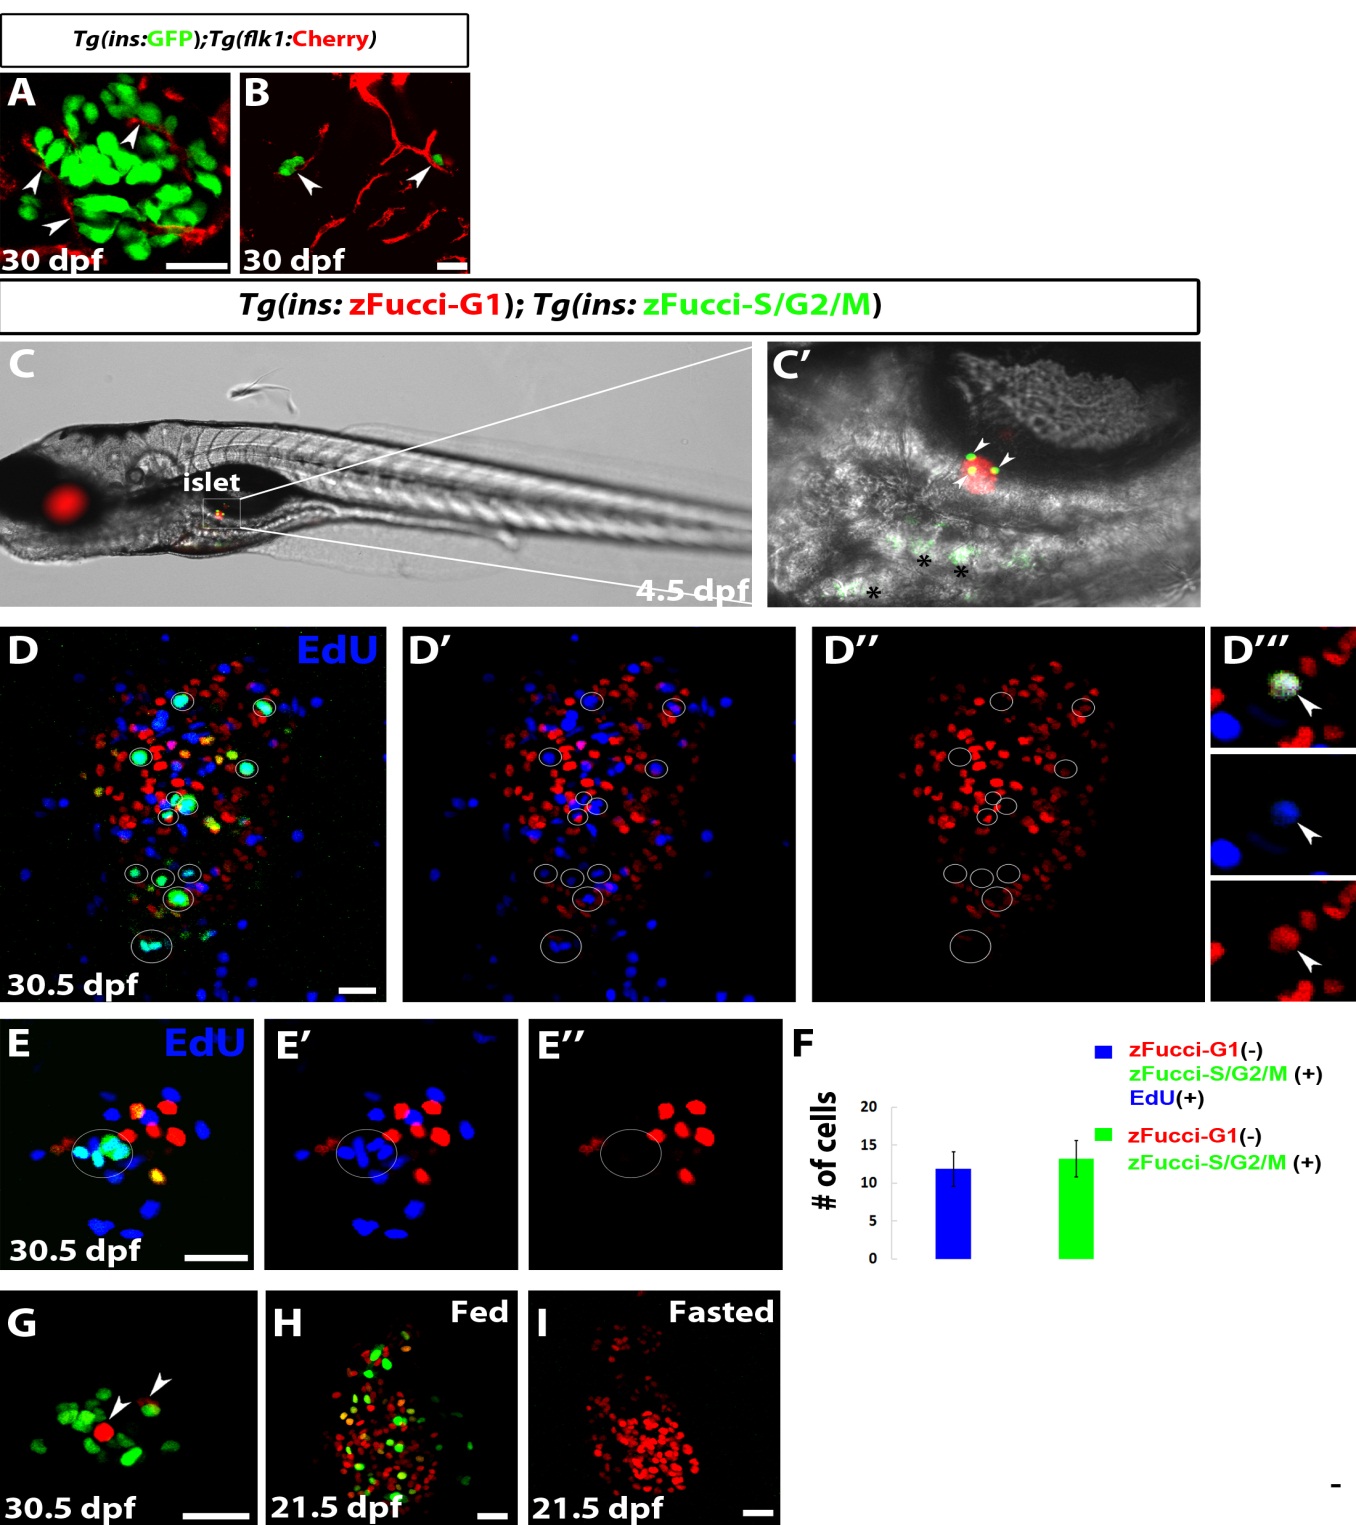
Secondary Islets Are Vascularized; Development of Transgenic FUCCI Reporters for Dynamic Assessment of β Cell Proliferation, Related to Figure 1
(A and B) Tg(ins:GFP);Tg(flk1:ras-Cherry) expression labels β-cells and blood vessels, respectively. (A) Single plane through a large SI. Individual β-cells appear to be in direct contact with blood vessels (arrowheads) (30dpf). (B) Projection of several planes showing two small SIs (arrowheads) closely associated with blood vessels (30 dpf).
(C and C′) Tg(ins:zFucci-G1);Tg(ins:zFucci-S/G2/M) larvae were examined at 4.5dpf using epifluorescence. A close up of the PI is shown in C′. A majority of the β-cells are Tg(ins:zFucci-G1)+ but Tg(ins:zFucci-S/G2/M)- indicating that they are in the G1 phase of the cell cycle. Only three β-cells are Tg(ins:zFucci-S/G2/M)+ (arrowheads). Asterisks indicate yolk auto-fluorescence.
(D and E) Tg(ins:zFucci-G1);Tg(ins:zFucci-S/G2/M) animals were incubated in EdU at 30dpf for 8h (5h after feeding).
(D–D′′) Projection of several planes through the PI. All Tg(ins:zFucci- S/G2/M)+;Tg(ins:zFucci-G1)- β-cells are outlined by a white circle. All of them are EdU+ whereas a majority of Tg(ins:zFucci-S/G2/M)-;Tg(ins:zFucci-G1)+ β-cells are EdU-.
(D′′′) High magnification single plane though the PI. A Tg(ins:zFucci- S/G2/M)+;Tg(ins:zFucci-G1)+ β-cell (arrowhead) exhibits low levels of EdU incorporation, suggesting that it is in an early stage of S-phase. 9 out of 167 double positive cells (in 7 animals) exhibited EdU incorporation.
(E) Single plane through an SI. Analogous to D, all Tg(ins:zFucci- S/G2/M)+;Tg(ins:zFucci-G1)- β-cells (outlined by a white circle) are EdU+.
(F) Quantification of the number of Tg(ins:zFucci-S/G2/M)+ ;Tg(ins:zFucci-G1)- ;EdU+ and Tg(ins:zFucci-S/G2/M)+ ;Tg(ins:zFucci-G1)- β-cells (n=9 animals). Note that the total number of proliferating β-cells per PI was lower than usual probably due to the stress caused by incubating the animals in EdU.
(G) The proliferation of β-cells in SIs was examined in regularly fed Tg(ins:zFucci-G1);Tg(ins:zFucci-S/G2/M) animals at 30.5dpf. A majority of the β-cells in an SI were proliferating (green). Only two β-cells (red) were quiescent (arrowheads).
(H and I) Tg(ins:zFucci-G1);Tg(ins:zFucci-S/G2/M) animals were fed regularly (H) or fasted for 24h (I) and examined at 21.5dpf. Fasting induced quiescence in all β-cells in the PI (projection of stack). Error bars = s.e.m.. Scale bars, 20 μm.