
|
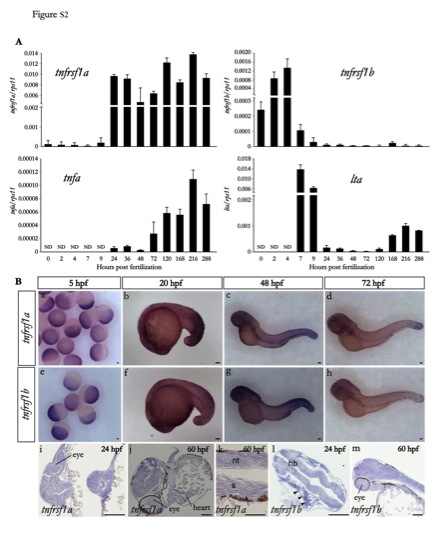
Fig. S2 Expression of tnfrsf1a, tnfrsf1b and their ligands tnfa and lta during zebrafish embryonic and larval development. (A) The mRNA levels of the gene encoding the TNFRs (tnfrsf1a and tnfrsf1b) and their ligands (tnfa and lta) were determined by real-time RT-PCR in 10-30 pooled larvae at the indicated times. The gene expression is normalized against rps11, each bar represents the mean ± S.E. of triplicate readings from pooled larvae and the data are representative of three independent experiments. ND: not detected. (B) tnfrsf1a and tnfrsf1b whole-mount in situ hybridization (ISH) (a-h) and ISH on sagittal sections (i-m). Embryonic stages and used antisense riboprobes were as indicated in each panel. Anterior is to the left, dorsal to the top in all panels except in i, where dorsal is to the left. (a,b and e,f). Note that in general, the expression pattern is rather ubiquitous. tnfrsf1a expression did not appear to be restricted to the vascular endothelium (arrow in k marks intersegmental vessel). A stronger expression of tnfrsf1b could be observed in the head mesenchyme (arrow in l). hpf, hours postfertilization; nt, notochord; s, somite. Scale bars, 100 μm.