
Image
|
Figure Caption
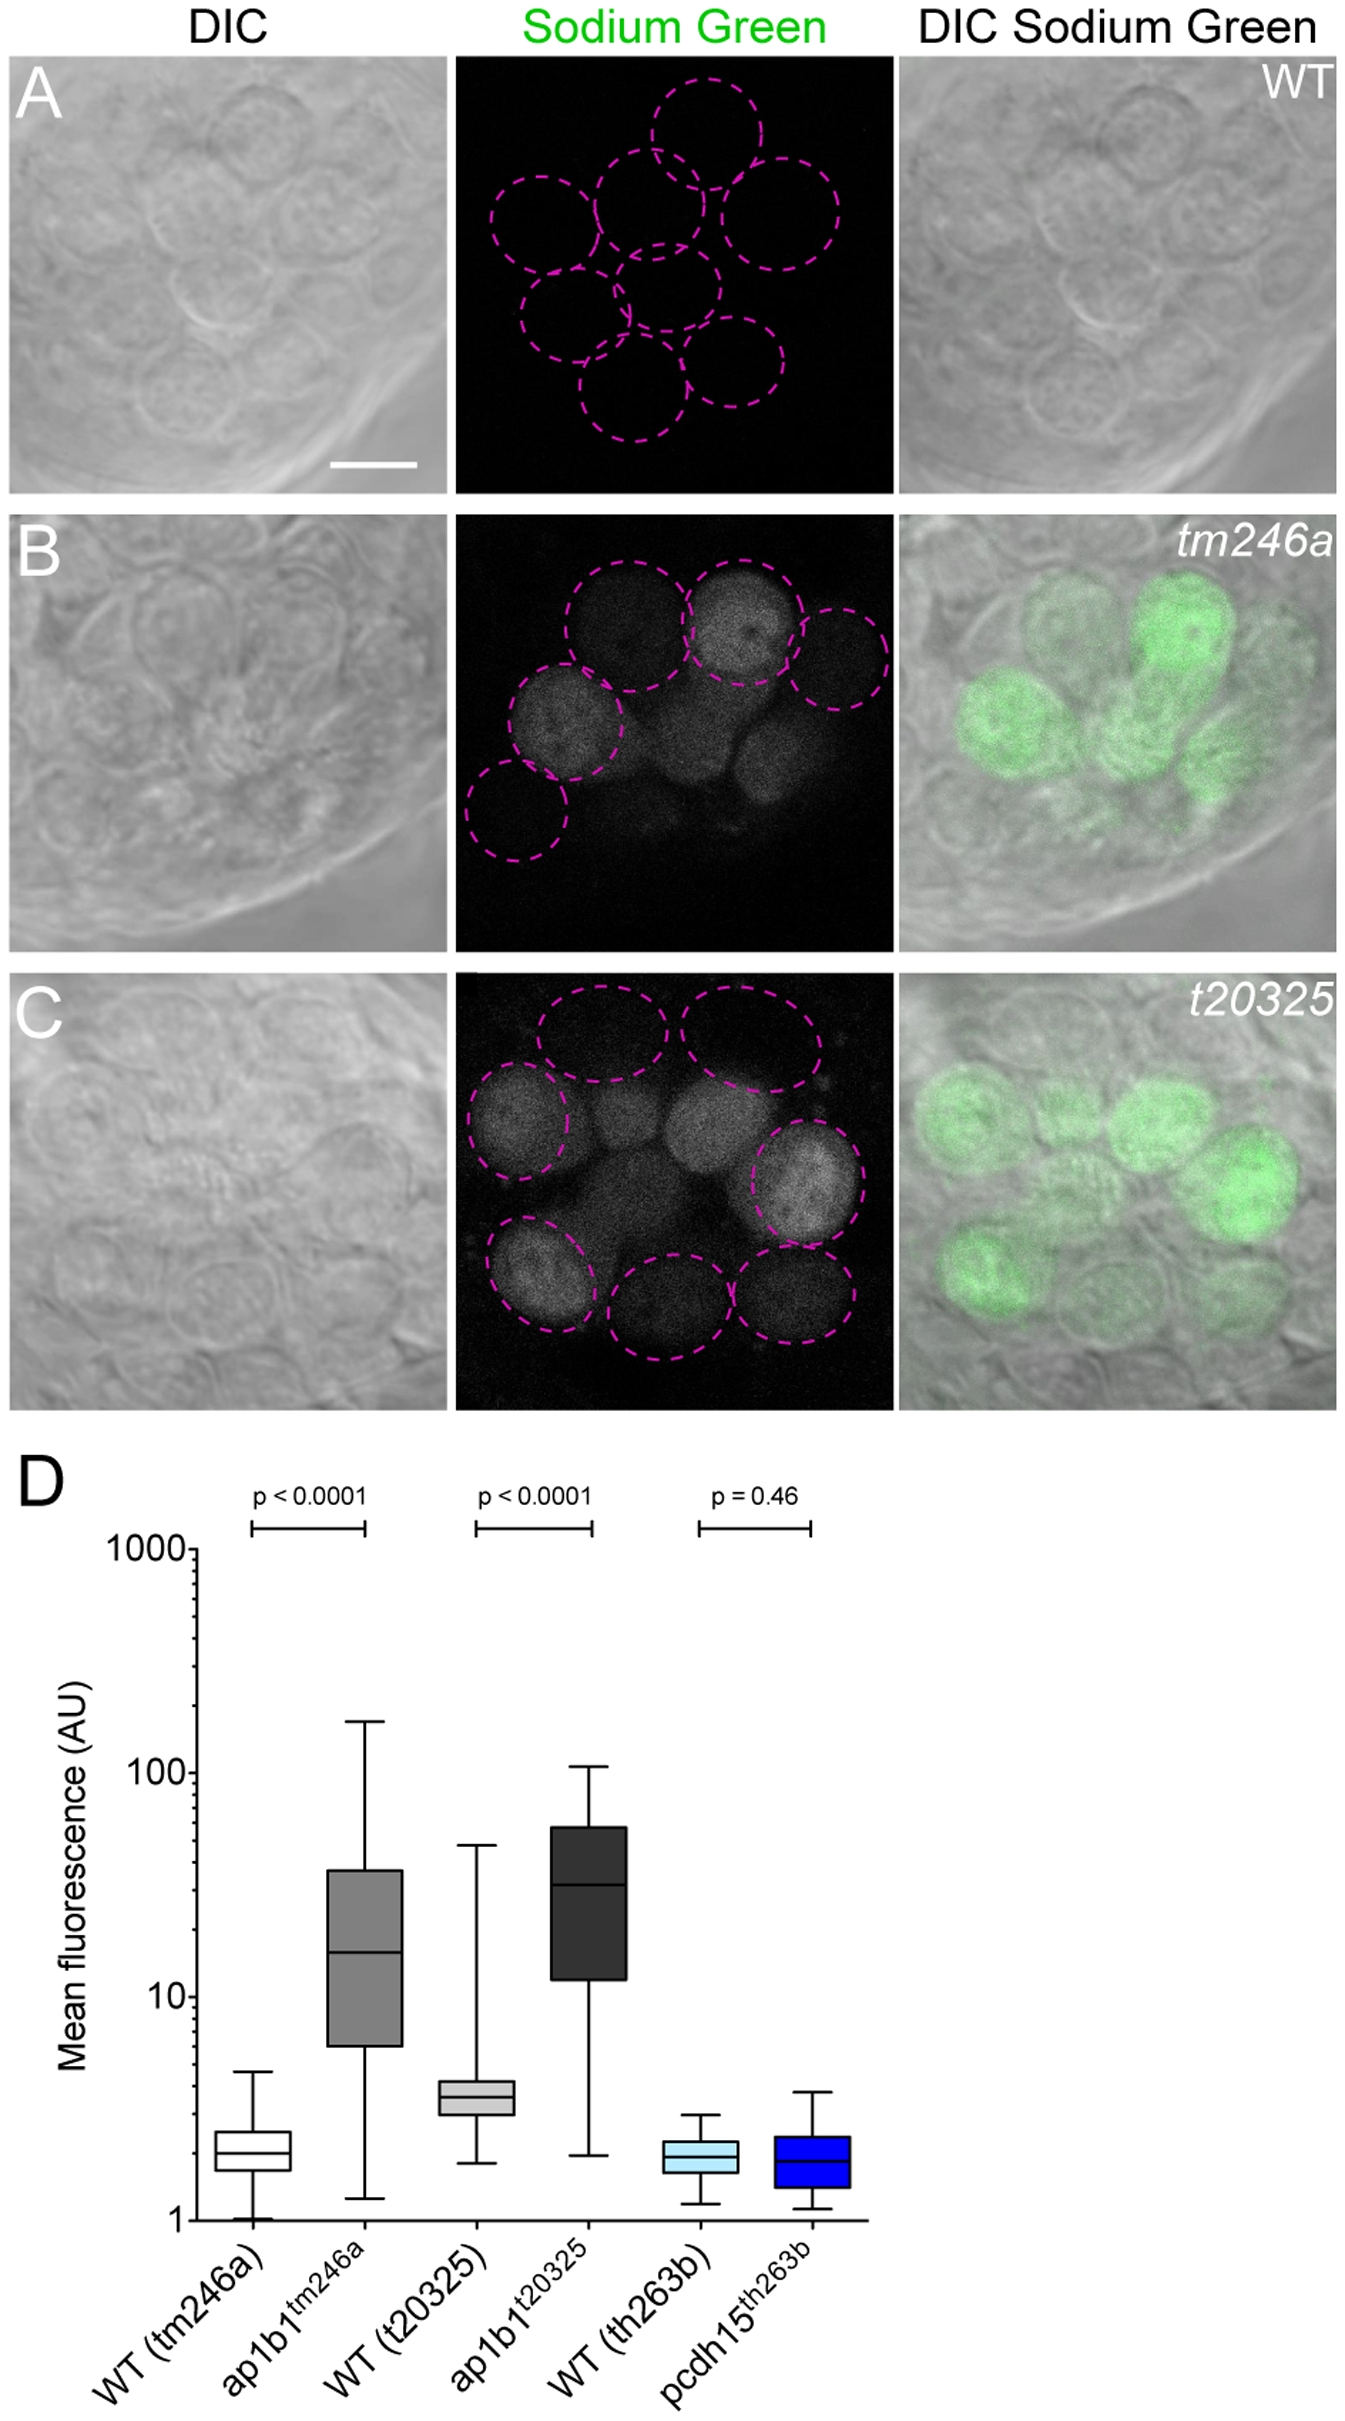
Fig. 7
Increase of intracellular Na+ levels in mutant HCs.
A–C, Sodium Green label in WT, tm246a and t20325 mutant neuromasts. Dotted magenta circles outline HCs that were used for quantification in that plane of view. Scale bar, 5 µm. D, Quantification of Sodium Green label in ap1b1 mutant, pcdh15th263b, and corresponding WT HCs. (tm246a: WT n = 124, mutant n = 90; t20325: WT n = 125, mutant n = 74; th263b: WT n = 100, mutant n = 84 HCs). Error bars represent SEM. Statistical analysis performed with a Mann-Whitney U-test.
Figure Data
Acknowledgments
This image is the copyrighted work of the attributed author or publisher, and
ZFIN has permission only to display this image to its users.
Additional permissions should be obtained from the applicable author or publisher of the image.
Full text @ PLoS One