
Image
|
Figure Caption
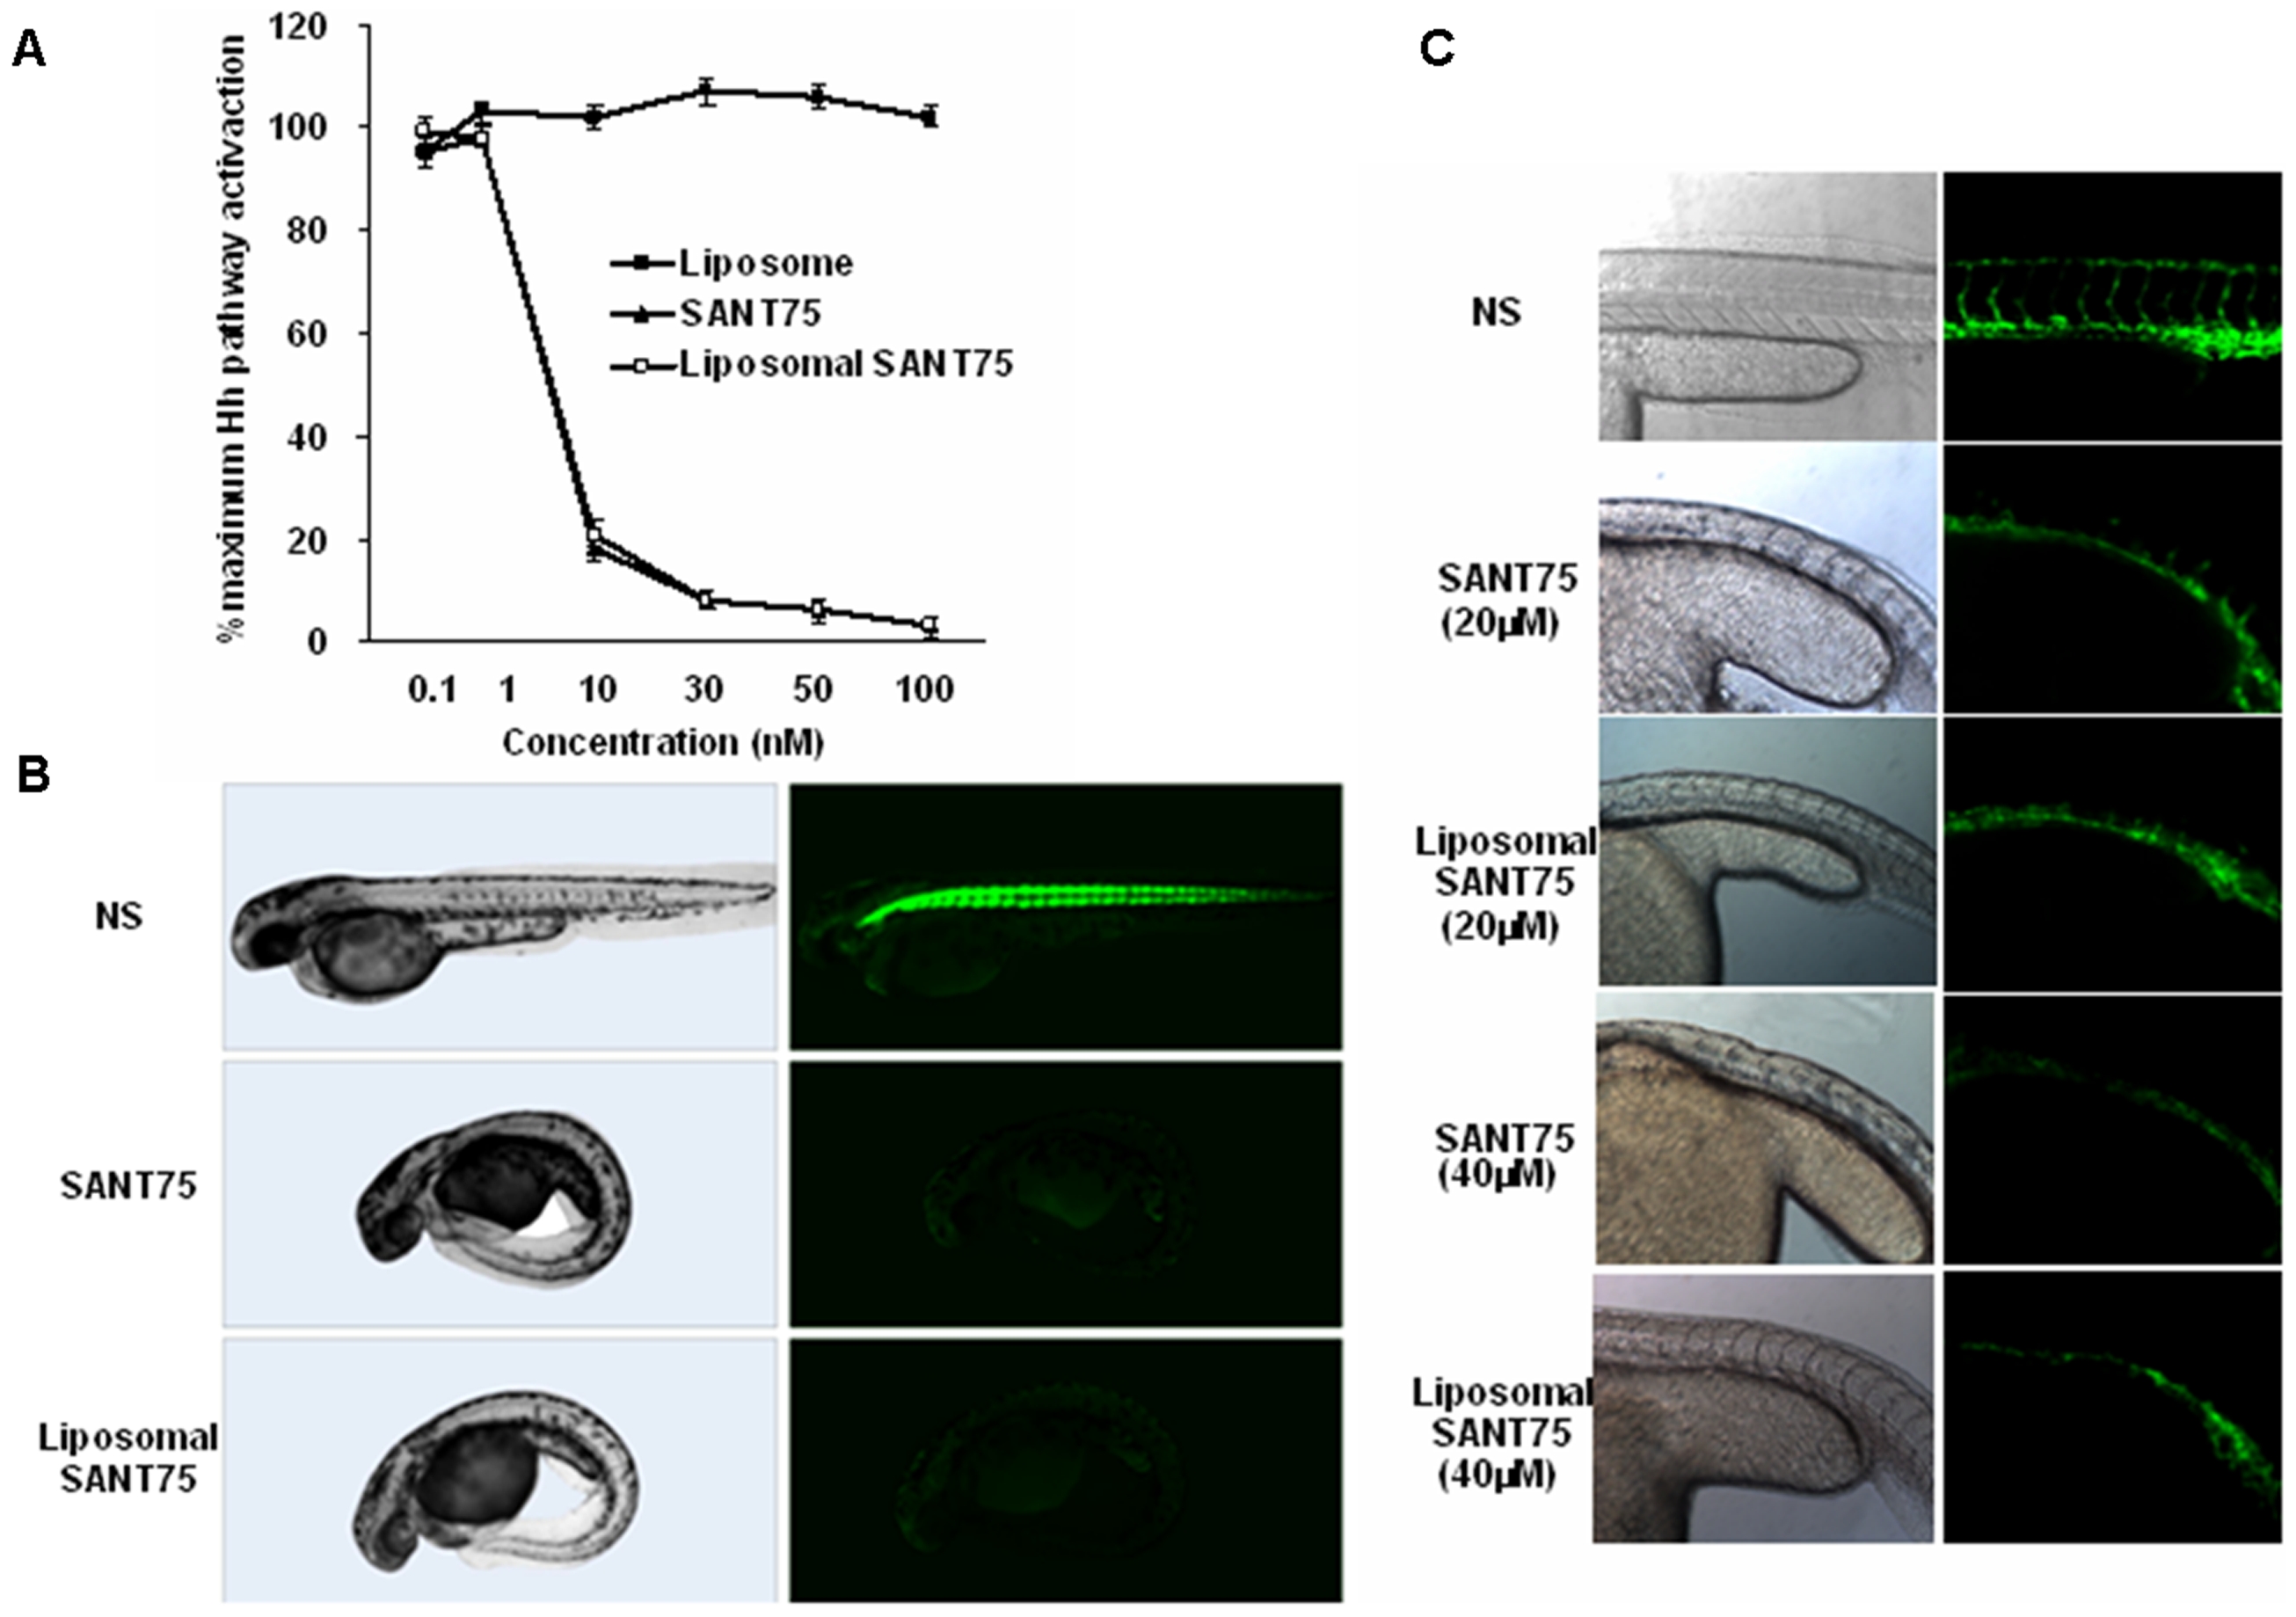
Fig. 2
Characterization. Of liposomal SANT75 in Shh-light2 cell and transgenic zebrafish assays.
(A) Inhibition of Hh activation by liposomal SANT75 and free SANT75 in SHh-light2 cells. IC50s for both are approximately 5 nM. (B) Inhibition of Hh activity in vivo by liposomal SANT75 and free SANT75 using Gli-GFP reporter in transgenic zebrafish embryos. (C) Inhibition of inter-segmental blood vessel by liposomal SANT75 and free SANT75 in Flk-GFP transgenic zebrafish embryos.
Acknowledgments
This image is the copyrighted work of the attributed author or publisher, and
ZFIN has permission only to display this image to its users.
Additional permissions should be obtained from the applicable author or publisher of the image.
Full text @ PLoS One