
|
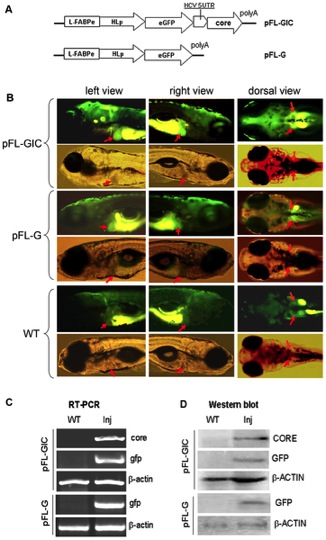
Fig. 1 Expression of Core and GFP in zebrafish larvae.
A. Diagrams of plasmid constructs. In pFL-GIC the core cds and GFP cds are driven by L-FABP enhancer and HL promoters, and separated by HCV IRES residing between them. pFL-G was a control construct without HCV IRES-core sequence. B. Observation of expression of GFP in 8-dpf zebrafish larvae under a flourescence microscopy. In each group, upper panel shows larvae images under the GFP excitation filter; lower panel shows the same larvae under visible light. Positive bright green fluorescence was seen in liver of the larvae injected with pFL-GIC or pFL-G, but in WT larvae only the auto-fluorescence appeared with yellowish fluorescence. Red Arrows indicate liver region in the larvae. A GFP filter (480 nm excitation, 505 nm emission) were used to excite the EGFP (Green). Original images were 40×. C. RT-PCR assay for transcription of core and gfp in pFL-GIC injected larvae, compared to that of pFL-G injection and that of wildtype larvae; β-actin was used as a loading control. All the larvae in this assay were collected at 10 dpf. D. Western blotting Assay for CORE and GFP proteins in pFL-GIC injected larvae, compared to that of pFL-G injection and that of wildtype larvae; β-ACTIN was used as a loading control. All the larvae in this assay were collected at 10 dpf.