
|
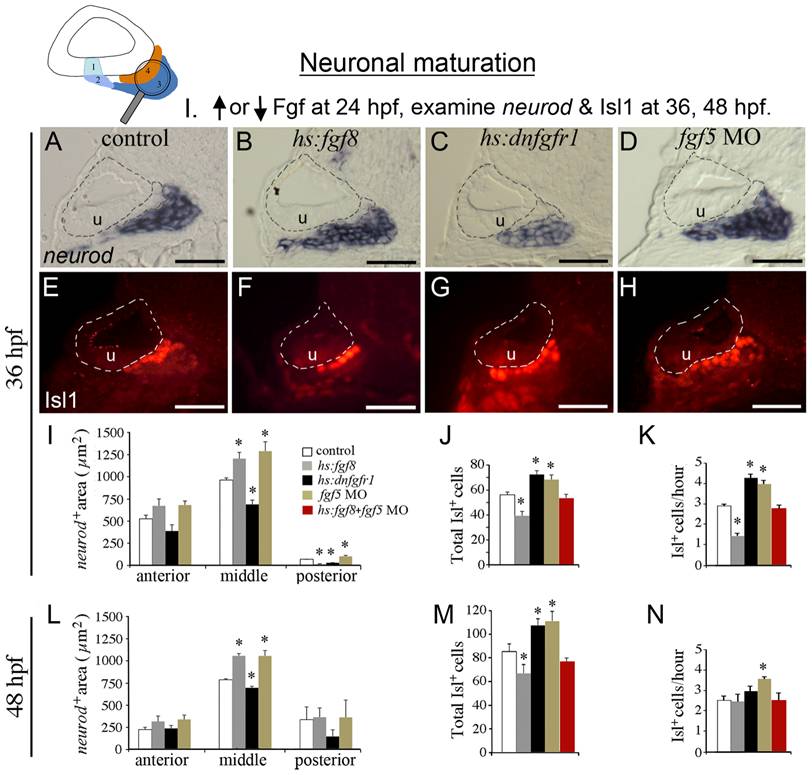
Fig. 8 Fgf regulates the balance between transit-amplification and differentiation.
The icon at the top of the figure indicates that neuronal maturation (neurod+ transit-amplifying cells and Isl1+ mature neurons) is the focus of analysis. Manipulations in these experiments (Neuronal maturation group I) are briefly summarized at the top. Embryos were heat shocked for 30 minutes at 39°C (wild-type controls, hs:fgf8/+ embryos, and fgf5-morphants) or 38°C (hs:dnfgfr1/+ embryos) beginning at 24 hpf. (A–H) Transverse sections (lateral to the left, dorsal up) showing neurod expression (A-D) or Isl1 staining (E-H) at 36 hpf in control embryo (A, E), hs:fgf8/+ embryos (B, F), hs:dnfgfr1/+ embryos (C, G) and fgf5 morphants (D, H). All sections shown pass through the middle region of the SAG at the level of the utricular macula (u). The otic vesicle is outlined. Scale bar, 25 μm. (I-N) Quantitation of transit-amplifying and mature neuronal populations at 36 hpf (I-K) and at 48 hpf (L–N). Panel I shows a color key to facilitate comparison between treatments: White bars, control; gray bars, hs:fgf8; black bars, hs:dnfgfr1; brown bars, fgf5 morphants; red bars, activation of hs:fgf8 in fgf5 morphants. Analysis of transverse sections was used to measure the mean area of neurod+ precursor cells (I, L) in the anterior, middle and posterior regions of SAG. The total number of Isl1+ neurons (J, M) and the mean hourly rate of neuron production from 24 hpf to 36 hpf (K) and from 36 to 48 hpf (N) was measured by counting neurons in stained wholemount specimens. Error bars in I, J, L, M indicate standard deviations (n = 3 or greater for sectional areas; n = 15 for Isl1+ cell counts). *p<0.05 in comparison to control, analyzed with Student′s t test. Error bars in K, N indicate standard errors.