
|
Fig. S6
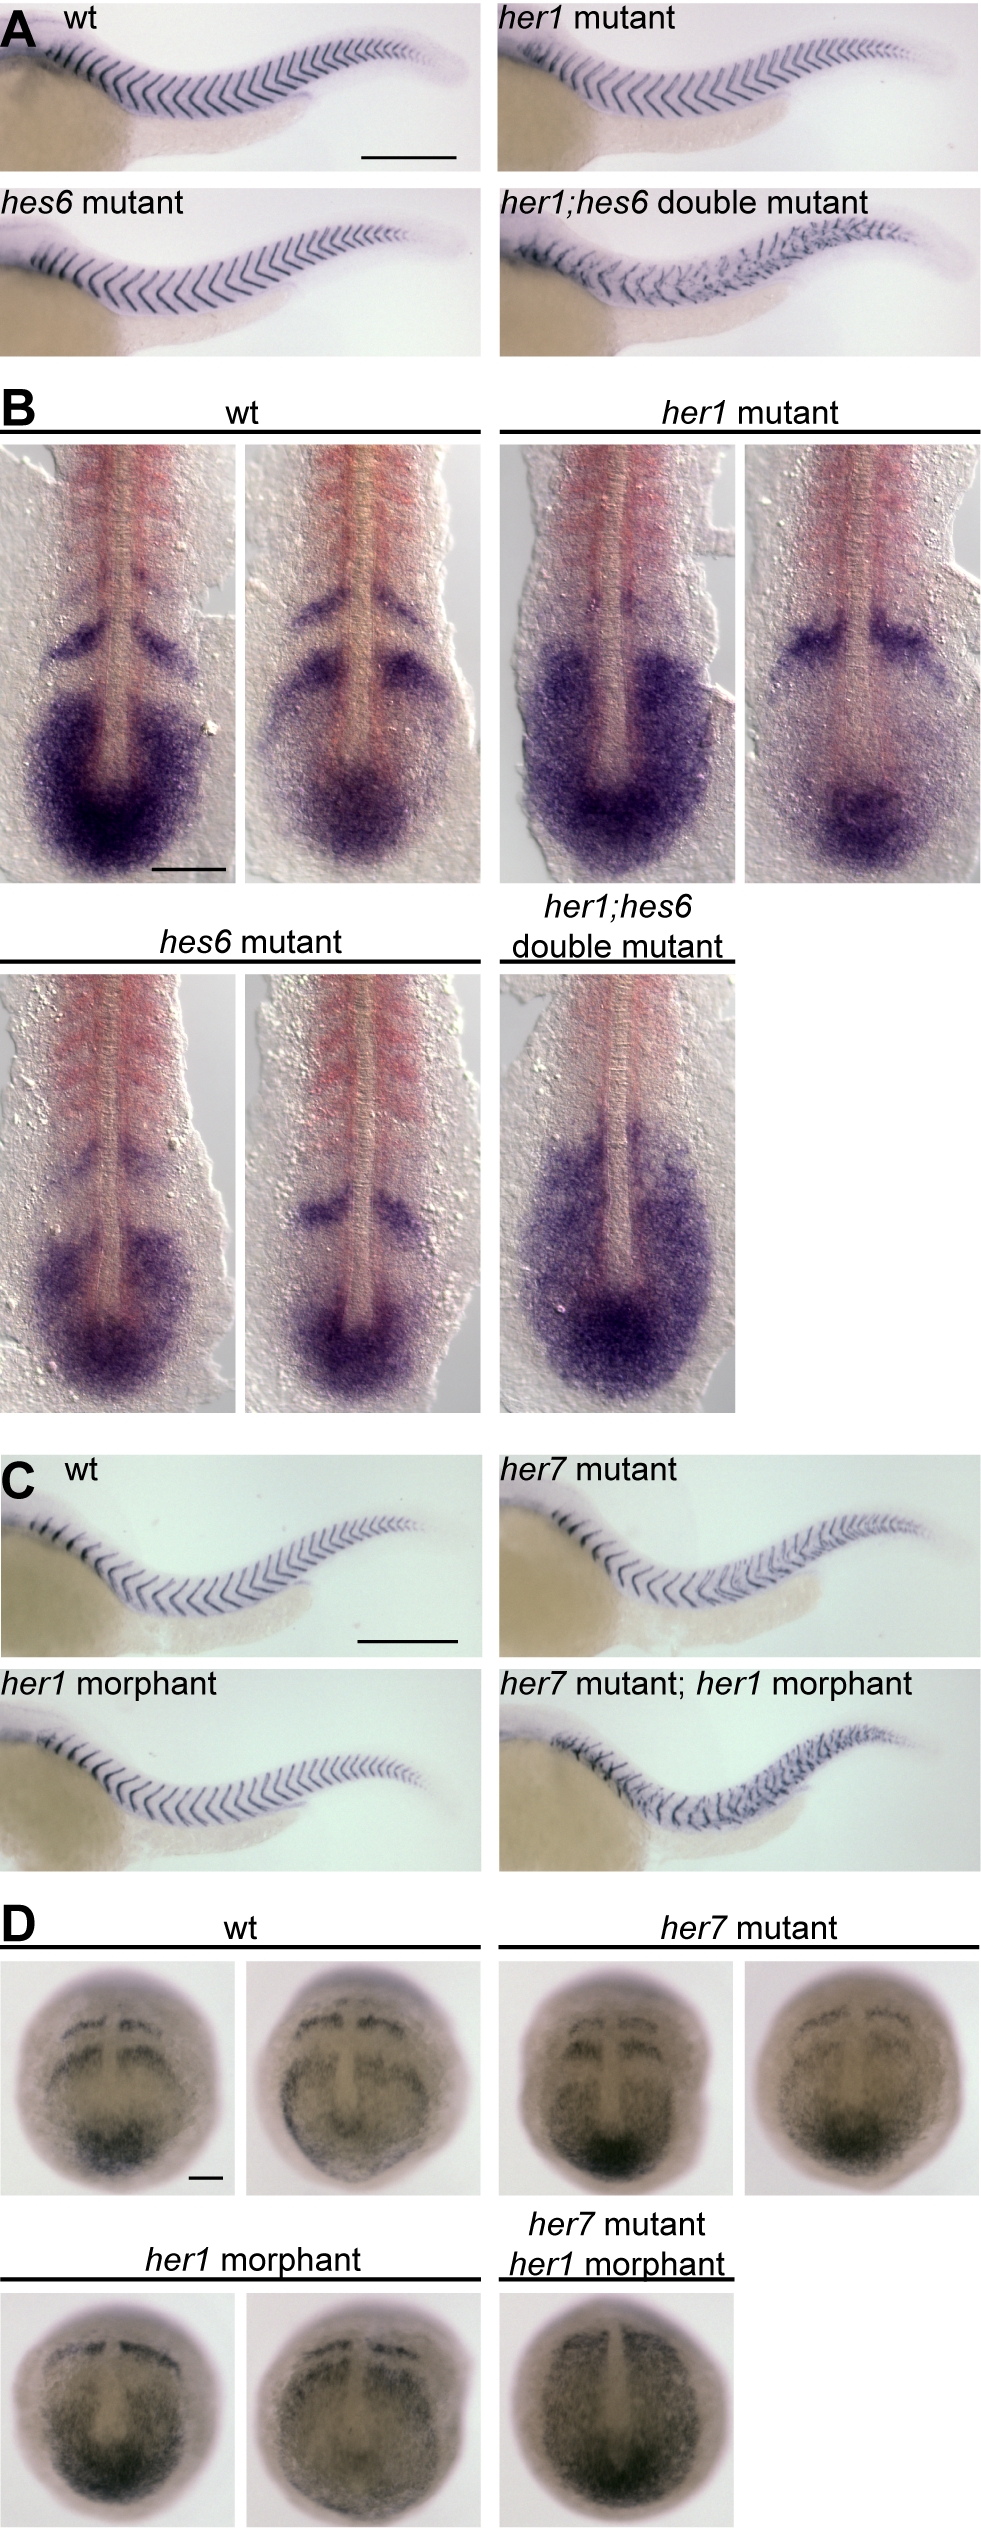
Combined loss of her1 and hes6 or her1 and her7 function fully disrupts segmentation and tissue-level oscillatory her7 expression. (A) Wildtype (wt), her1 mutant, hes6 mutant, and her1;hes6 double mutant embryos grown to 34 hpf and stained with the myotome boundary marker cb1045 to analyze segmentation. wt and the majority of her1 and hes6 single mutant embryos segment normally along the entire axis, whereas all her1;hes6 double mutant embryos display segmentation failure along the entire axis. Scale bar, 300 µm. (B) wt, her1 mutant, hes6 mutant, and her1;hes6 double mutant embryos at the 10-somite stained for her7 mRNA expression. Alternating wave patterns indicative for tissue-level oscillatory expression can be observed for wildtype, her1, and hes6 single mutant embryos (two representative examples shown for each genotype), but 26 out of 27 her1;hes6 double mutants display an equal level of her7 expression throughout the PSM. Scale bar, 100 µm. (C) wt and her7 mutant embryos were injected with her1-targeted MOs or left uninjected, grown until 34 hpf, and stained with the myotome boundary marker cb1045 to analyze segmentation phenotypes. All wildtype and the majority of her1 morphant embryos segment normally in the central trunk and tail, whereas her7 mutants display posterior segmentation defects. These defects are enhanced by injection of her1-targeted MOs into the mutant background, which leads to segmentation failure along the entire axis. Scale bar, 300 μm. (D) Uninjected and her1-MO-injected wt and her7 mutant embryos at bud-stage stained for her7 mRNA expression. Alternating wave patterns indicative for tissue-level oscillatory expression can be observed for uninjected and her1-MO-injected wt and uninjected her7 mutant embryos (two representative examples per condition shown), but her1 MO injection into her7 mutants leads to even her7 expression throughout the PSM (40 out of 40, one representative example shown). Scale bar, 100 μm.