
|
Fig. S3
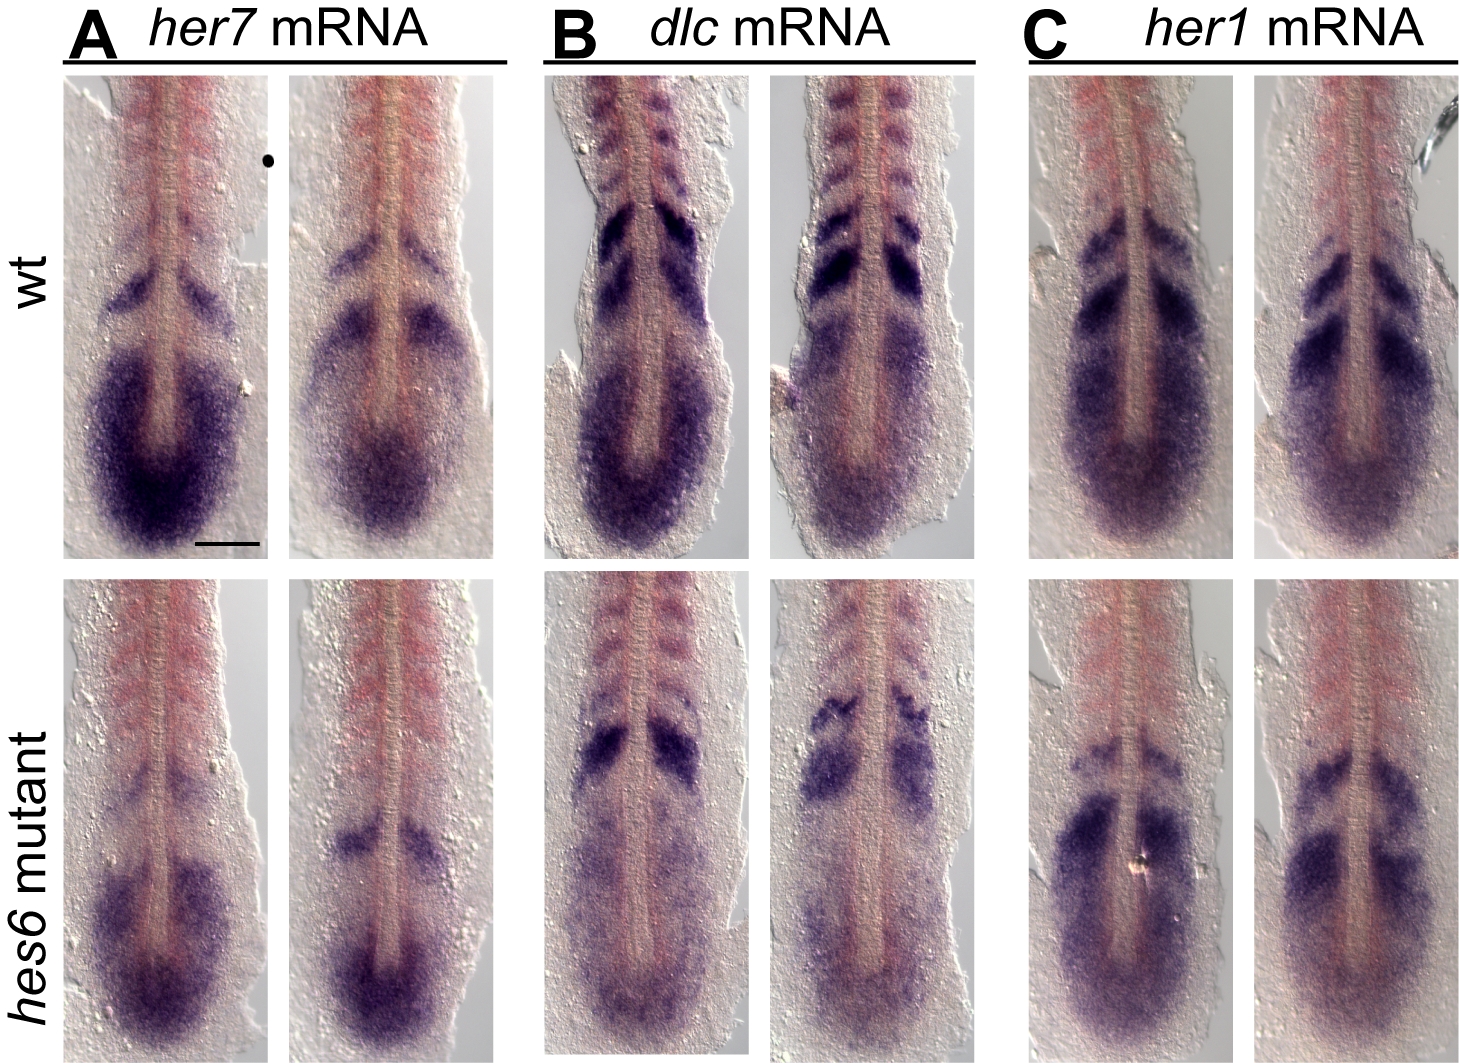
Tissue-level transcriptional oscillations in hes6 mutant embryos. Wildtype (wt, upper row) and hes6 mutant (lower row) embryos at the 10-somite stage in situ stained for her7 (A), dlc (B), or her1 (C) mRNA expression (blue). in situ staining for myoD expression (red) marks formed somites. Flat mount preparations, anterior to the top, scale bar 100 μm. Alternating patterns indicative of tissue-level oscillatory gene expression are evident for each probe. This is in contrast to a previous study, where MO-mediated hes6 knockdown resulted in loss of oscillatory expression of her1, her7, and dlc [18]. These discrepancies could be caused by off-target effects of the MOs used in [18] or by raising the embryos at different temperatures in the two studies. Note that the embryos shown here were raised at 28.5°C, where the majority of hes6 mutant embryos segments normally [17].