
|
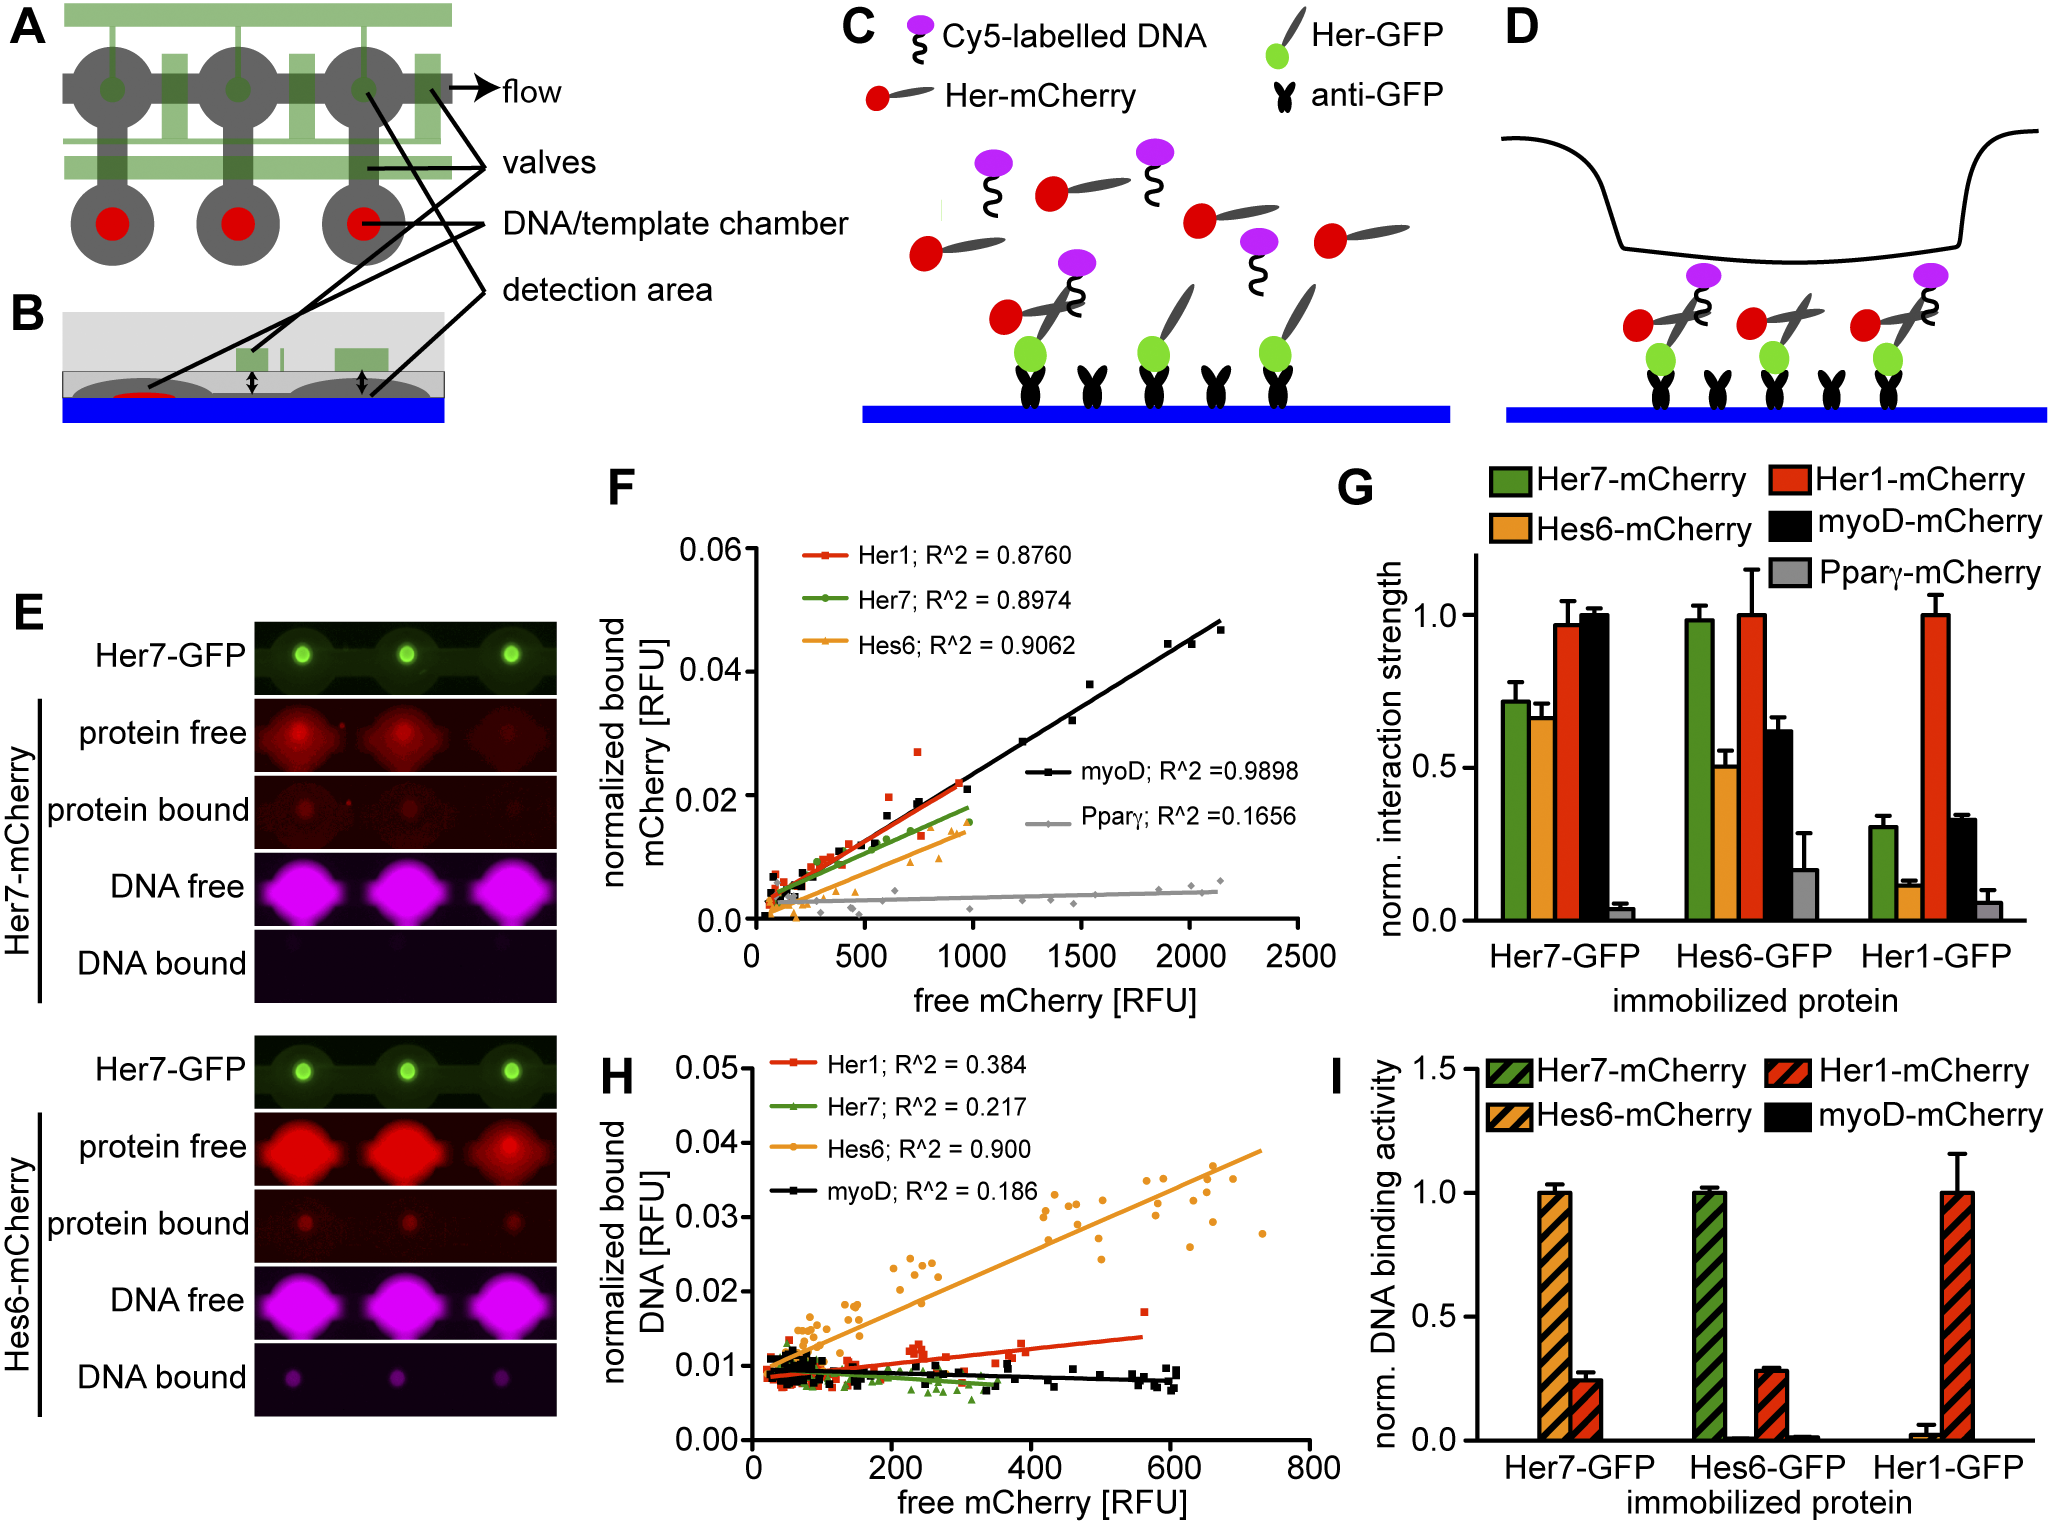
Fig. 1
bHLH proteins in the segmentation clock interact promiscuously, but only few dimers bind DNA.
(A–D) Schematic of MITOMI setup. (A) Top view of three unit cells, (B) cross-section of one unit cell. Flow layer in grey, control layer in green, supporting glass slide in blue, and spots of expression template or target DNA in red. (C) GFP-tagged Her protein is immobilized on the slide surface with anti-GFP antibodies. mCherry-tagged Her protein is expressed in the chamber in the presence of Cy5-labelled DNA and allowed to bind to the immobilized protein. (D) The valve over the detection area (black line) is actuated to displace unbound protein and DNA and detect specific interactions. (E) Representative images of six chambers of a microfluidic chip with Her7-GFP (green) coupled to the chip surface with Her7-mCherry (upper panels) or Hes6-mCherry (lower panels) expressed from expression templates spotted on the chip in the presence of a Cy5-labeled DNA oligomer. Both Her7-mCherry and Hes6-mCherry interact with Her7-GFP, but only the combination of Her7-GFP and Hes6-mCherry binds DNA. (F) Quantitative analysis of protein-protein interaction of Her7-GFP with Her1-mCherry, Hes6-mCherry, Her7-mCherry, myoD-mCherry, and PPARγ-mCherry. mCherry signal in solution is plotted against the bound signal in the detection area. The slopes of the linear fit to the data points for each mCherry-tagged protein provide relative measures of their interaction strengths with Her7-GFP. (G) Relative strength of protein-protein interactions between Her1, Her7, Hes6, myoD, and PPARγ assayed as in (F), with Her7-GFP (left), Hes6-GFP (middle), or Her1-GFP (right) coupled to the chip surface. Bars represent the slopes ± standard error of the linear fits as shown in (F), with the slope of the strongest interaction normalized to one for each experiment. (H) Quantitative analysis of DNA binding activity of Her7 homo- and heterodimers. mCherry signal in solution is plotted against signal of bound DNA in the detection area; the slopes of linear fits to the data give a relative measure of the DNA binding activity of the different bHLH dimers. (I) Relative DNA binding activity of dimers formed between Her1, Her7, Hes6, and myoD assayed as in (H), with Her7-GFP (left), Hes6-GFP (middle), or Her1-GFP (right) coupled to the chip surface. Bars represent the slopes ± standard error of the linear fits as shown in (H), with the slope of the strongest interaction normalized to one for each chip.