
|
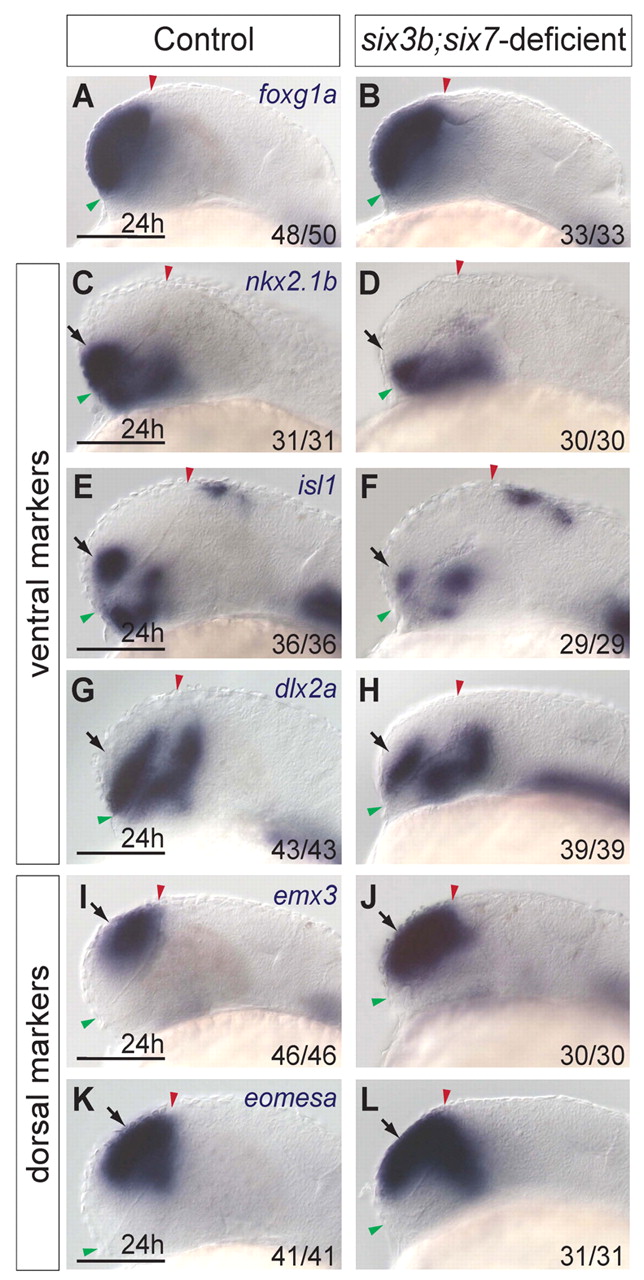
Fig. 1 The telencephalon of six3b;six7-deficient embryos is dorsalized. (A,B) foxg1a expression in control (A) and six3b;six7-deficient (B) embryos. (C-H) Ventral telencephalic expression of nkx2.1b (C,D), isl1 (E,F) and dlx2a (G,H) in control (C,E,G) and six3b;six7-deficient (D,F,H) embryos. (I-L) Dorsal telencephalic expression of emx3 (I,J) and eomesa (K,L) in control (I,K) and six3b;six7-deficient (J,L) embryos. All embryos are at 24 hpf. Control embryos are uninjected six3bvu87/+ or six3bvu87/vu87 embryos. Arrows indicate telencephalic expression domains. Embryos are shown in lateral view with anterior towards the left. Red and green arrowheads indicate dorsal and ventral edges of the telencephalon, respectively. Fraction in each panel denotes number of embryos affected over number examined. Scale bars: 100 μm.