
|
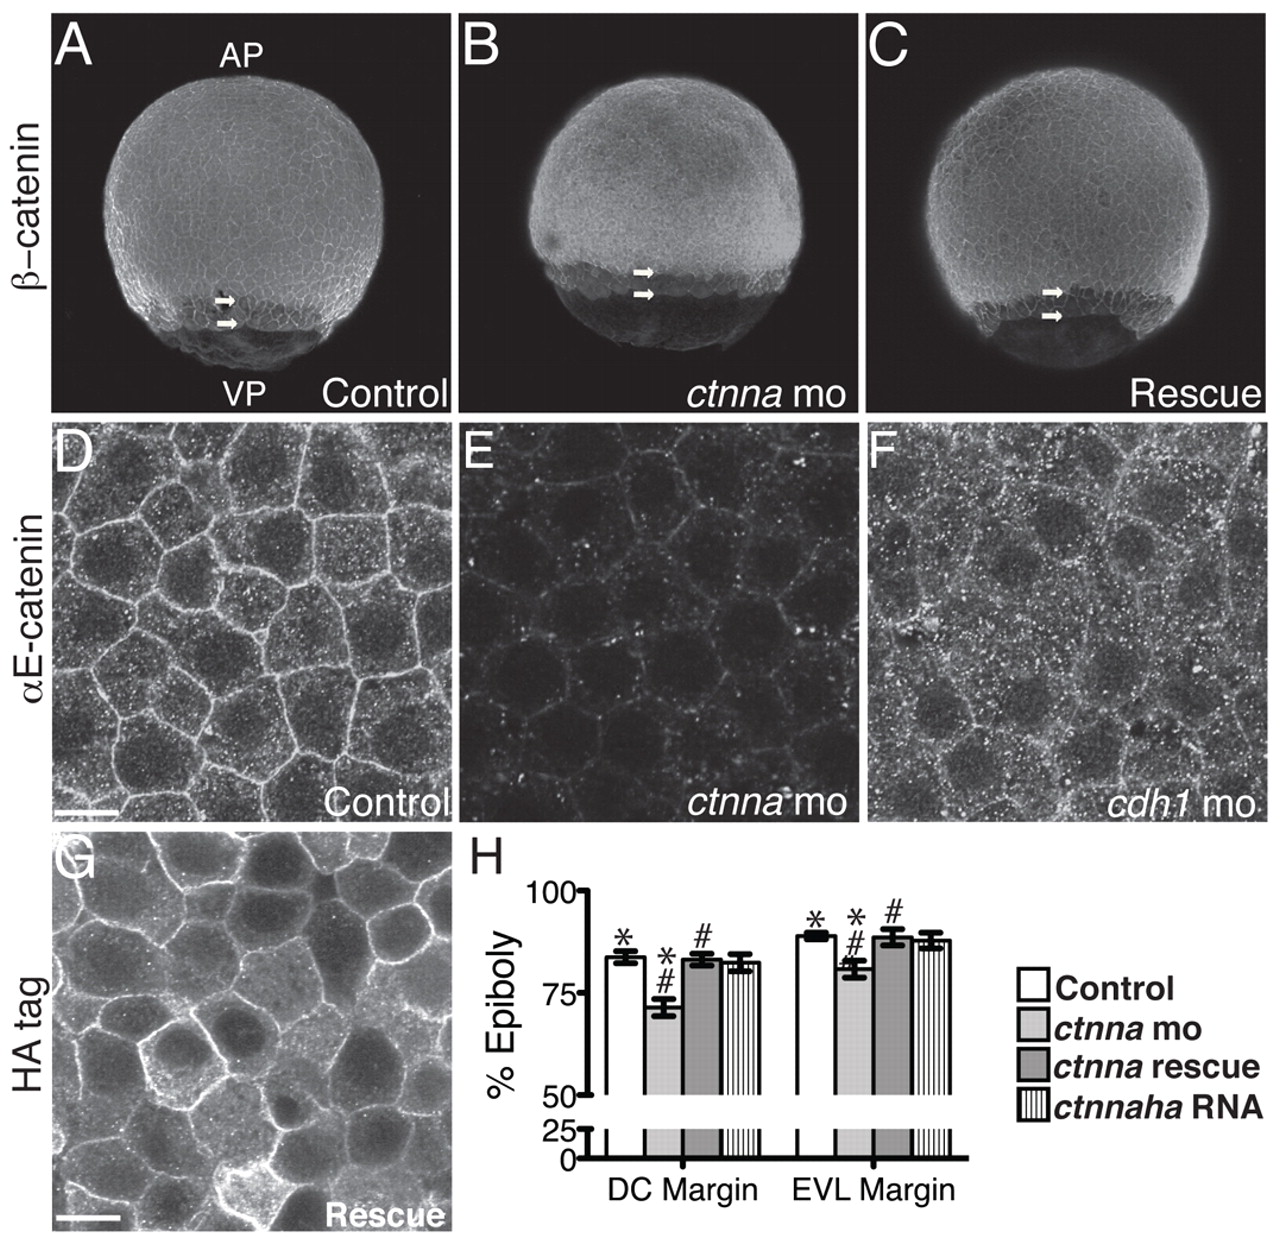
Fig. 2
ctnna morphants are delayed in epiboly. (A-C) Immunofluorescence images of fixed zebrafish embryos stained for β-catenin. AP, animal pole; VP, vegetal pole. Upper arrow indicates deep cell margin, lower arrow indicates EVL margin. (D-F) Confocal fluorescence images of Ctnna antibody staining of the most external epiblast layer at the animal pole of embryos at 50% epiboly. Scale bar: 10 μm. (G) Rescue embryos stained for the HA tag; same view as D-F. Scale bar: 10 μm. (H) Percentage of epiboly of the deep cell (DC) and EVL margins. Three independent experiments, n=25 embryos. *P<0.006, #P<0.001. Error bars indicate s.d.