
|
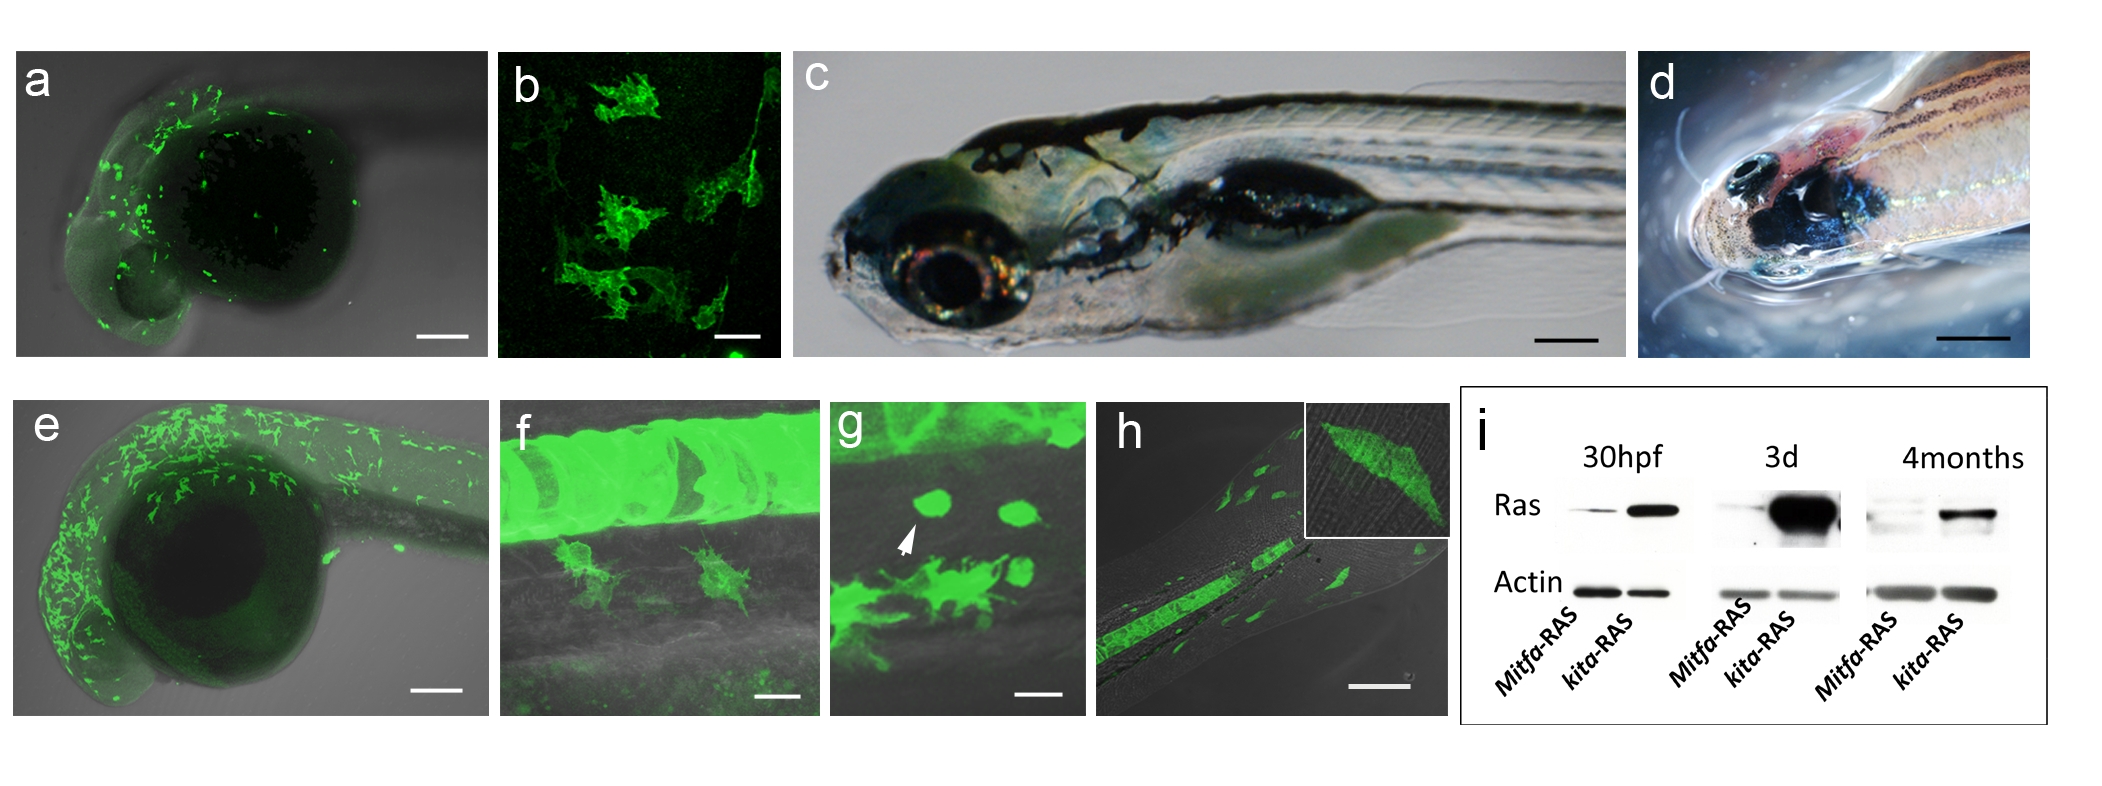
Fig. S4 Similarities and differences between mitfa-GFP-RAS and kita-GFP-RAS transgenic lines. a–b, e–f) Similar expression pattern, but different number of GFP-RAS migrating melanocyte progenitors at 32 hpf in mitfa-GFP (a,b) and kita-GFP (e,f) double transgenic zebrafish. c) Normal pigmentation in a 5 dpf mitfa-GFP-RAS larva. d) The only melanoma that developed in mitfa-GFP-RAS fish by three months of age (n = 25). g–h) Other cell types expressing GFP under the kita promoter. Melanocytes and mucous cells (arrows) in kita-GFP 3dpf larvae (g). Flat epithelial cells (enlarged in inset), present in the fins of kita-GFP 3 dpf larvae (k). These cells do not change in number or size upon expression of HRAS. i). Western Blot analysis of protein extracts from double transgenic fish at the age indicated in the upper lane. Increased levels of Ras in kita:GFP-RAS versus mita:GFP-RAS fish. Calibration bars: 50 μm in a–b;e–n; 2 mm in c–d.