
|
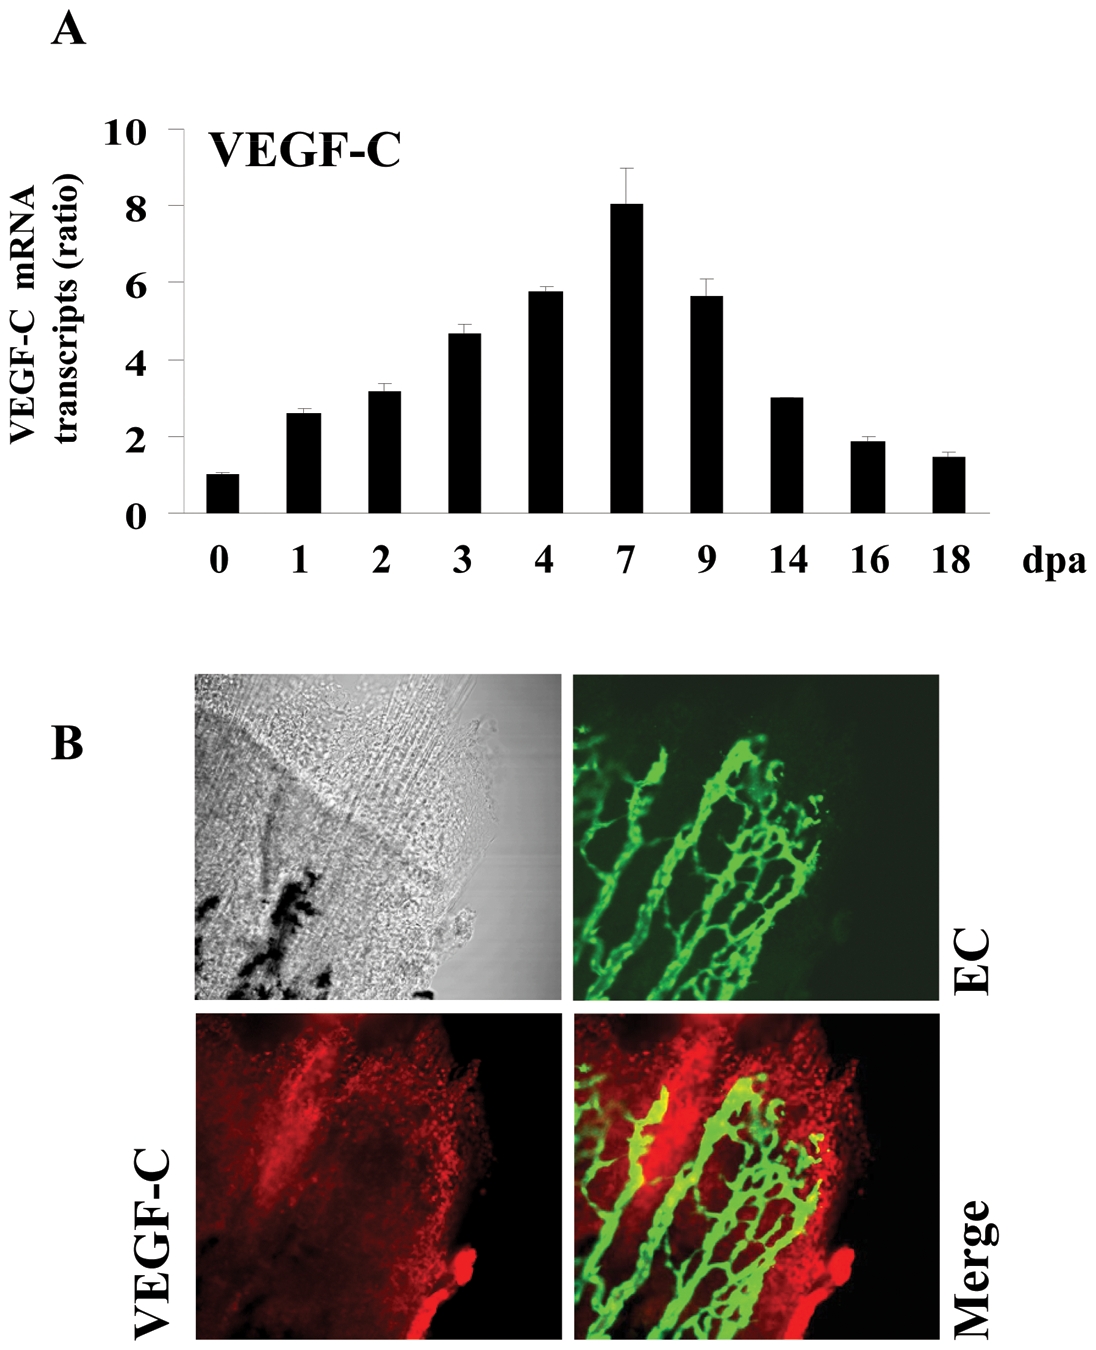
Fig. 5 Expression of VEGF-C during fin regeneration.
Adult zebrafish were anesthetized in tricaine and fins were cut using razor blades. (A) Total RNA was isolated from fins (15–20 fins per time point) with uncut fin as control (0 dpa) and analyzed by real-time PCR using specific primers for zebrafish VEGF-C or β-actin. Results are shown in the bar graph and are expressed as the ratio of the indicated transcripts relative to control (0 dpa). Results are shown as means ± S.E. of three experiments performed in triplicate. (B) Expression patterns of VEGF-C at 3 dpa were analyzed by immunofluorescence with an anti-VEGF-C (red signal) using fli-EGFP transgenic zebra fish that allows the visualisation of endothelial cells (EC) (green signal). The expression of VEGF-C was mainly localized to the apical growth zone of the regenerating fin (red signal, 25x objective).