
|
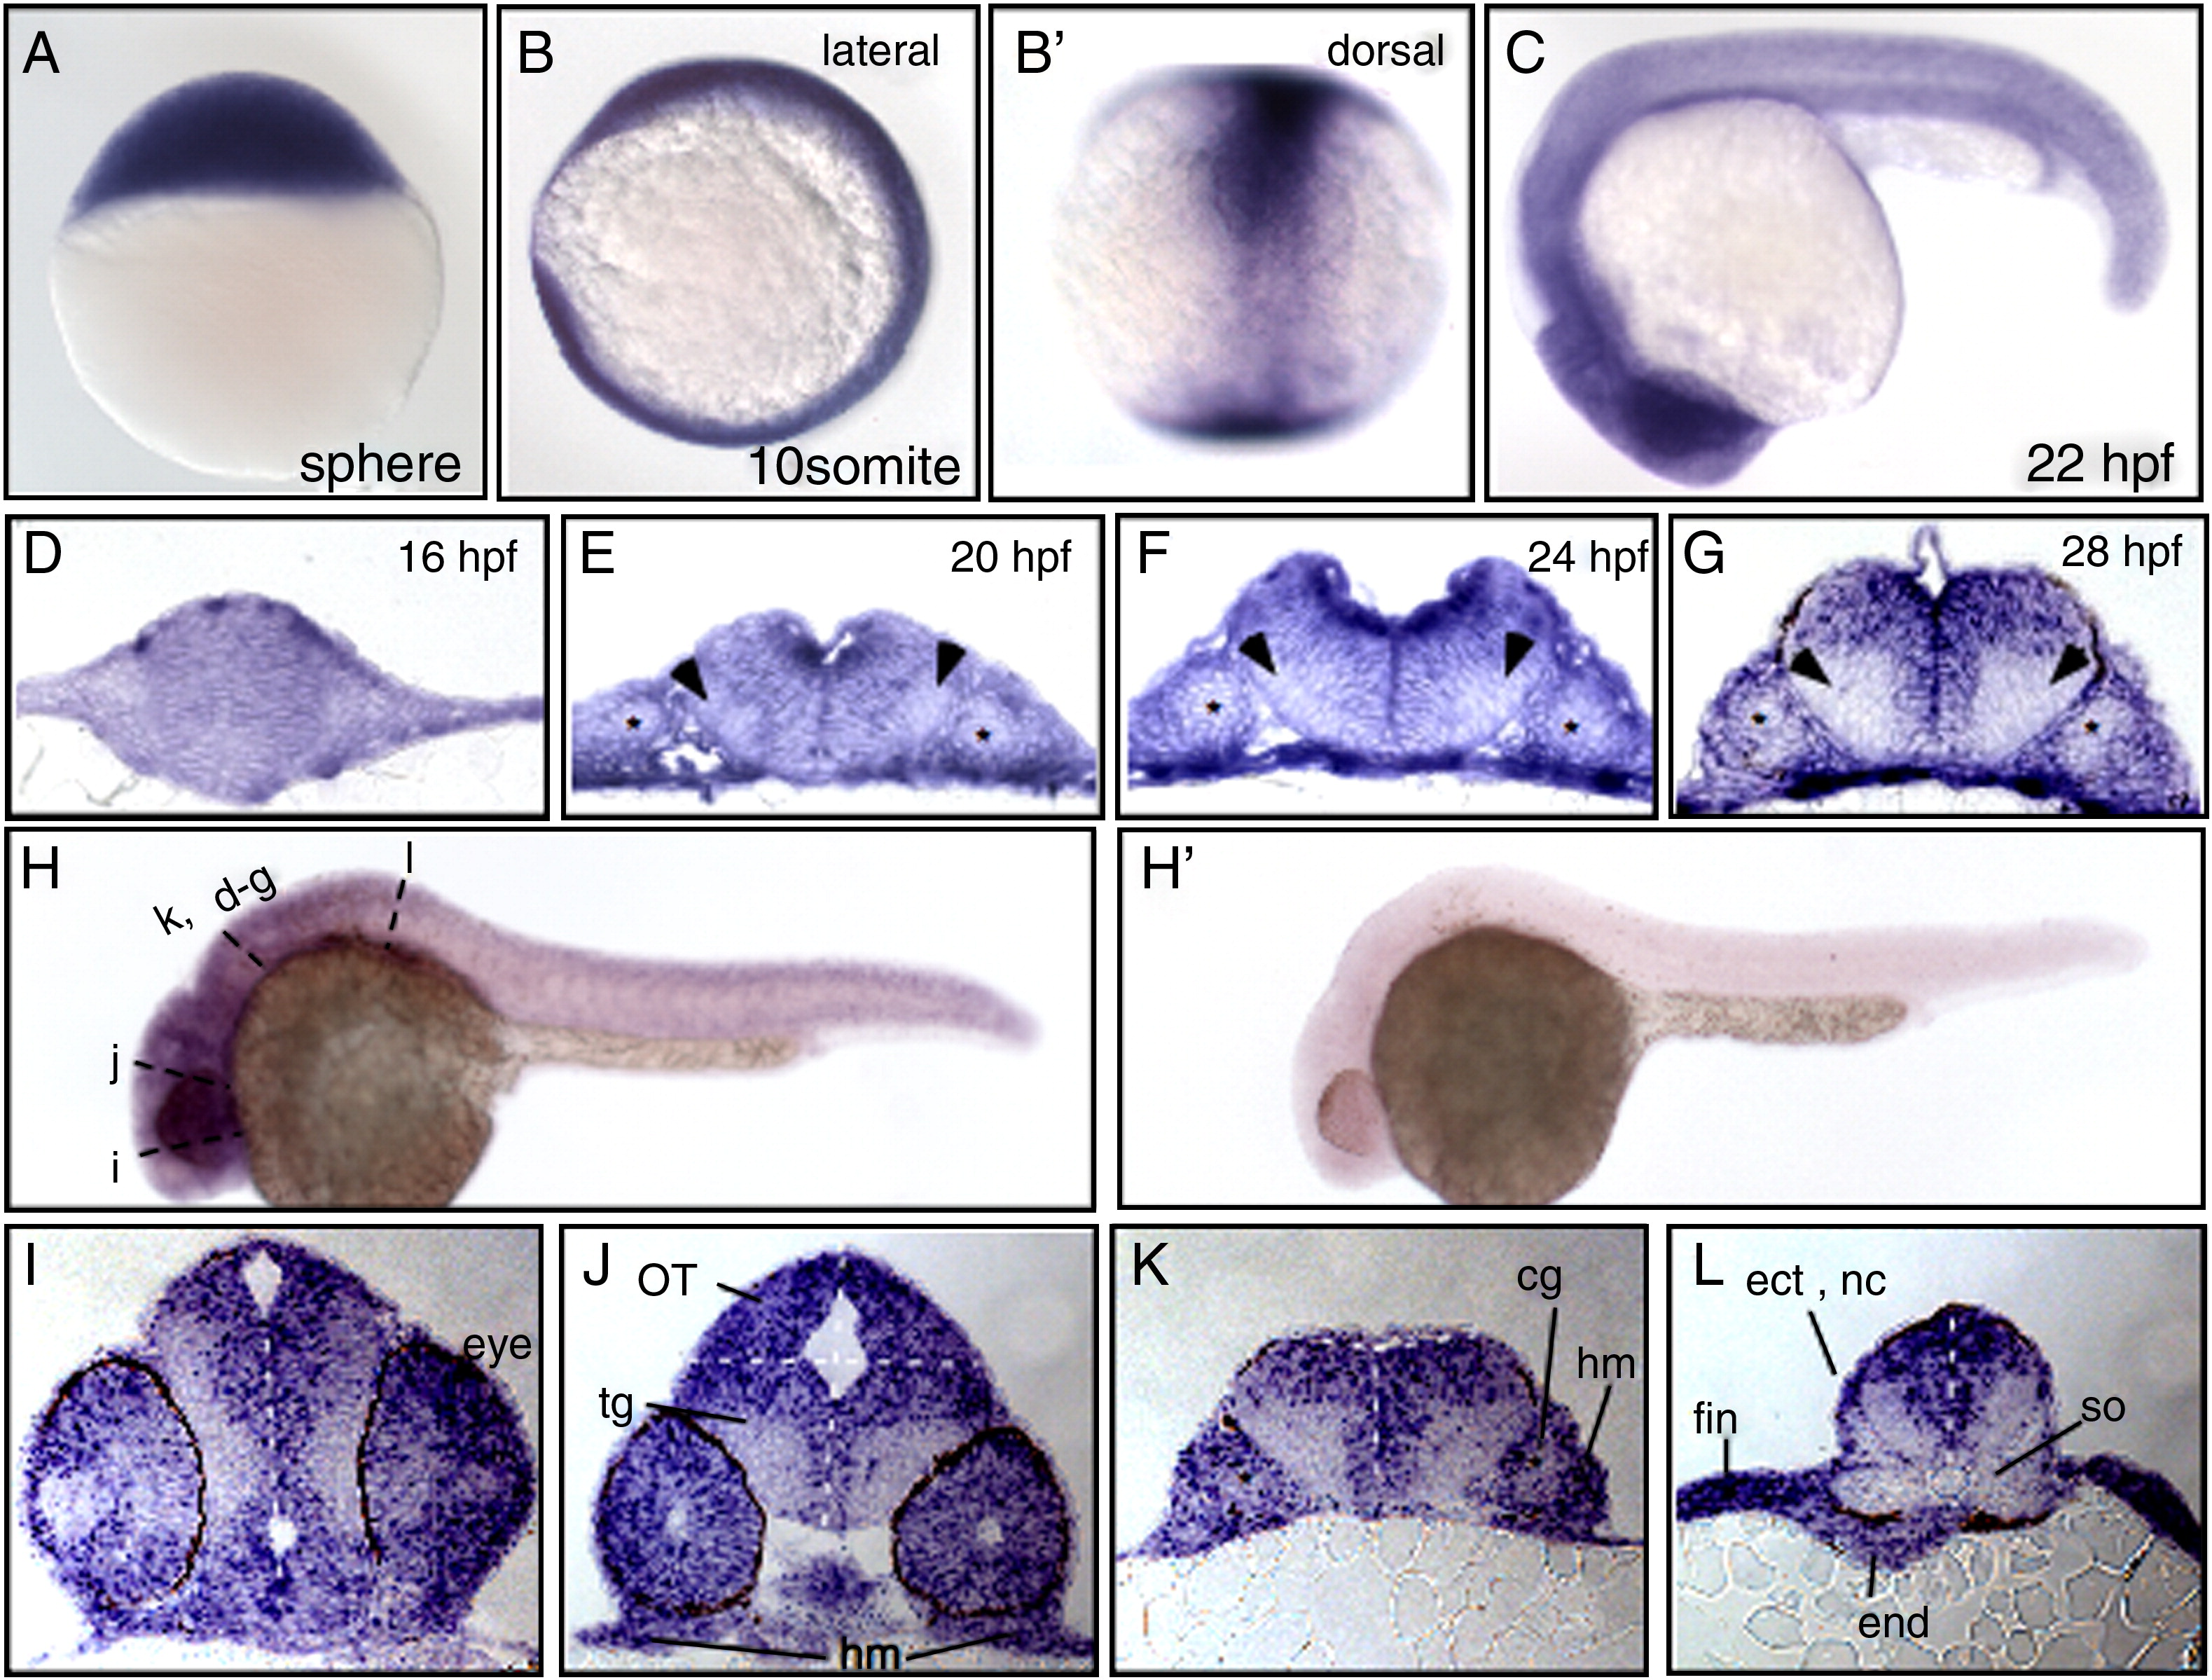
Fig. 1 Expression of rest during early zebrafish development. mRNA in situ hybridization with antisense rest probe, except H′ where rest sense strand was used. Wholemounts (A–C, H) and transverse sections (D–G, I–L) of wild-type embryos during the first 42 h of development. (A, B, D) Early expression is ubiquitous. (C–G) Expression remains widespread at 22 hpf (C) and 25 hpf (H) but transverse sections of hindbrain reveal progressive downregulation as neurogenesis takes place in ventrolateral domains (arrowheads, E–G). (I–L) Sections of 42 hpf embryo, taken at levels indicated in (H). The pattern of rest expression is similar along the anterior–posterior axis. rest is expressed in mitotic cells of the ventricular zone, (marked by white dashed line) and undifferentiated neural structures such as the eyes (I, J), and optic tectum (OT, J). (J–L) Most tissue outside the neural tube still expresses rest at this stage, such as the head mesenchyme (hm J, K), developing fins (L) endodermal tissue (end, L) neural crest (nc, L) and ectoderm surrounding the somites (ect, L) but not the the already differentiated somites (L, so) and sensory cranial ganglia (cg, K). cg, cranial ganglia; ect, ectoderm; end, endoderm; hm, head mesenchyme; OT, optic tectum; tg, tegmentum.
Reprinted from Developmental Biology, 340(2), Gates, K.P., Mentzer, L., Karlstrom, R.O., and Sirotkin, H.I., The transcriptional repressor REST/NRSF modulates hedgehog signaling, 293-305, Copyright (2010) with permission from Elsevier. Full text @ Dev. Biol.