
|
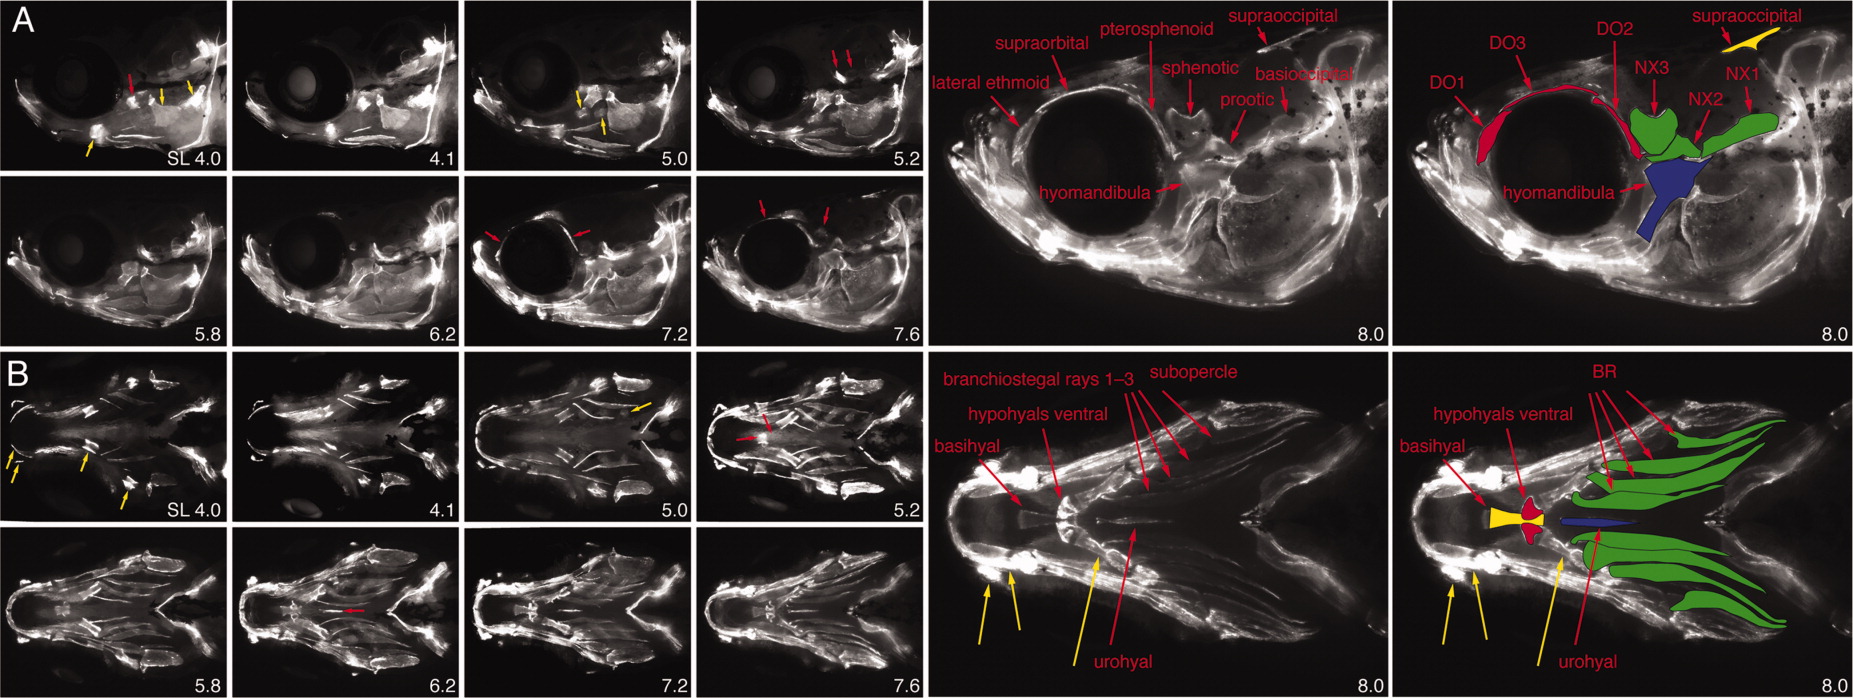
Fig. 6 Ossification of craniofacial skeleton revealed by calcein staining. Lateral and ventral views are of the same individuals; different individuals are shown across stages (standard length [SL] in lower right of each panel). All images are projections that flatten multiple focal planes. Selected skeletal elements are indicated with arrows (annotations are provided left to right in each panel unless otherwise noted; red arrow and regular type below = scored quantitatively; yellow arrow and italic type below = additional bones not scored). Overlays indicate skeletal units scored in Figure 7. A: 4.0, quadrate, hyomandibula, opercle, ceratobranchial 5; 5.0, ceratobranchial 2, ceratobranchial 3; 5.2, prootic, basioccipital; 7.2, lateral ethmoid, pterosphenoid; 7.8, supraorbital, sphenotic; 8.0, red overlay = dorso-orbital complex [DO1, lateral ethmoid; DO2, pterosphenoid, DO3, supraorbital], green overlay = notochord extension complex [NX1, basioccipital; NX2, prootic; NX3, sphenotic]; blue overlay = hyomandibula; yellow overlay = supraoccipital. B: 4.0, dentary, infraorbital, ceratohyal, hyomandibula (scored for lateral view); 5.0, ceratobranchial 4; 5.2, ventral hypohyals, basihyal; 6.2, urohyal; 8.0, infraorbital 1, dentary, ceratohyal, yellow overlay = basihyal, red overlay = ventral hypohyals, green overlay = branchiostegal ray complex [BR, branchiostegal rays], blue overlay = urohyal.